Project URL: https://share.streamlit.io/cmu-ids-2021/fp--zhiyun/main/main.py
Active Learning is a special case in Machine Learning that starts with a small number of data points, and interactively suggest new instances to evaluate, and aims to maximize the performance metrics of the model using as few as possible data poin ts. Bayesian Optimization is an efficient way to optimize a black box function faster by suggesting new parameters based on the prior knowledge of evaluated data. These two techniques can help with training a regression model on or maximize/minimize a blac k box function in different areas of scientific research. The application BOARD Bay esian Optimization and Active Regression Dashboard built in the project is a dashboard where researchers who are not familiar with running Bayesian Optimization or Active Learning experiments programmaticall y can complete the tasks i n an interactive and user friendly way.
- Gaussian Process
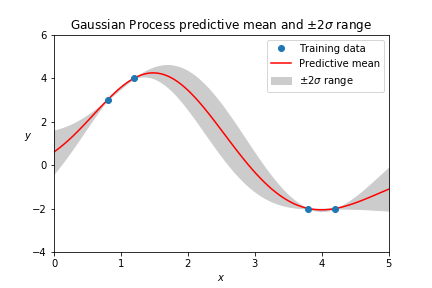
Gaussian Process regression is a commonly used model to approximate black-box functions based on prior knowledge and to make predictions in the unknown area with uncertainty.
- Bayesian Optimization
In scientific research, optimization of measurements by tuning parameters and regression model training are two common problems. In many experiments, there are multiple design parameters (or independent variables) that can take multiple or even i nfinite number s of values, which makes the searching space very large and hence an exhaustive search infeasible or impossible. Thus, Bayesian Optimization, which utilizes the historical data as prior knowledge, fits a probabilistic surrogate function and suggests a new candidate likely to improve the modeling of the objective function for evaluation according to the posterior, could help researchers find optimal designs faster. In Bayesian Optimization, Gaussian Process is the commonly used surrogate mod el to model the objective function by incorporating knowledge of the previously evaluated data instances. While selecting the next experiment(s) to evaluate, to balance the probability of exploiting near the current optimal design and exploring in the regi on with the greatest uncertainty, utility functions are often applied. Upper Confidence Bound (UCB) is one of the most commonly used utility function s , which primarily favors exploration, but switches to favor ing exploitation around the current optimal des ign as gaining more information elsewhere it has explored. In each iteration, the experimental design(s) with the highest utility will be selected to evaluate next.
- Active learning
Active learning aims to train machine learning models more efficiently. Instead of requiring all training data to be labeled beforehand, active learning starts with a small training set, and interactively queries labels for more instances in the region of the design space where the model is most uncertain. Wh en training a regression model in an active learning way, the model should be able to estimate the uncertainty of the unlabeled data and to model the unknown function with decent variability and less bias (eg. a simple linear regression model may have too much bias and fail to model the complexity of the black box function). Thus, a Gaussian Process regression model seems to be a very good fit in this scenario.
- Datasets
1. Protein Directed Evolution (DE)
In the study published by Wu et al. the researchers aimed to find the mutant of the protein GB1 with the highest “fitness” (a measurement of t he protein’s stability and functionality) by mutating the amino acid at four positions in its protein sequence. There are 20 possible amino acids at each loc us in theory, but because of experimental constraints, the researchers were not able to produce all 20 4 variants, but only 149,361 of them. The fitness scores for the mutant are relative to the original wild type protein, meaning only those with fitness score s > 1 are considered beneficial. And it was found that only 2.4% of the mutants are beneficial. 3 In the paper published by In the paper published by Frisby and Langmead,Frisby and Langmead, ((2020)2020), the researchers performed, the researchers performed Bayesian Optimization on this dataset, and sho Bayesian Optimization on this dataset, and showed that within the budget of 191 wed that within the budget of 191 evaluations, the average maximum fitness found was about 5.3. Theevaluations, the average maximum fitness found was about 5.3. The mean and mean and median fitness in the DE dataset are 0.08 and 0.003, respective. median fitness in the DE dataset are 0.08 and 0.003, respective.
2. Buffer Composition A cell-free system is an in vitro system allowing researche rs to examine biological processes. While performing the experiments using this tool, the buffer composition can cause variation in the production efficiency of the system. In the study by Borkowski et al. al., they aimed to optimize the yield of a specific protein by tuning the concentration of 11 differen t substances in the buffer and t o train a regression model in an active learning fashion to predict the yield of specific buffer compositions.
Their results show that by training the committee regression model using active lea rning with a budget of 510 evaluations, the r2 of the model on the rest of the data as the testing set reached ~0.6.
- Applications I did not find any publicly available web application for active learning and Bayesian Optimization on the internet. Together wit h a new Bayesian Optimization algorithm named PROTOCOL (PaRallel OptimizaTiOn for ClOud developed in the research group I worked in, a shiny based web application for performing BO tasks is about to be published. That app was designed for Bay esian Optimization, and uses Membership Query Synthesis strategy, such that the algorithm can synthesize any new experiment designs within the searching space for the users to evaluate.
The models for both tasks are implemented by the modAL and sc i kit learn packages. There are no criteria for the performance of the model to be considered as good, because the expectation may vary drastically in different fields of research and types of experiment. It depends on the users’ field specific knowledge t o decide when to stop the iterative optimization process.
- Active Regression
The regression model used in this app is a Gaussian Process (GP) model with a Radial Basis Function kernel. The criteria used to select non-evaluated designs for evaluation is the uncertainty of the predictions (standard deviation at those points in the Gaussian Distribution) made by the GP model trained on previously known data. In each iteration, new designs of the batch size specified by the user will be given by the application for the user to run further experiments accordingly and provide labels/measurements for them later. The performance measurement of the model is the r2 on its training data, and it’s updated after each time newly evaluated instances are incorporated.
- Bayesian Optimization
The surrogate model is a GP model with a Matern kernel. The Upper Confidence Bound utility function is applied, and instances of the batch size specified by the user with the highest UCB scores are returned for further evaluation. The performance measurement in this case is simply the highest objective value seen so far in the evaluated experiments.
- User Interface Design The user interface consists of two parts: the sidebar for settings, and the main body for performing the it erative model training or optimization.
In the sidebar, the user will first select whether they want to perform “Regression model training” or “Objective optimization”. Then the text files containing evaluated experiments and a pool of unlabeled instance s need to be uploaded. Finally, the “Fit the model” button will call corresponding functions to initialize the models using the uploaded data.
In the main body, there are three columns: 1) Left: batch size selection, all labeled data that has been learned by the model, current performance (r2 or maximum objective); 2) Middle: a scatter plot of all data instances in the unlabeled pool projected on the first 2 principal components, colored according to their utility (for Bayesian Optimization) or uncertainty (for Active Regression) level; 3) Right: a new batch of parameter designs to be evaluated, text input for the objective values of the new experiments, a button for retraining the model and updating the labeled and unlabeled pool.

- Workflow While performing the tasks using the app, the users will follow the flow in the diagram below. The task type and data need to be specified and uploaded in the sidebar before beginning the model training or optimization process. Once the task has begun, the user will be in the loop of the iterative training/optimization process with 3 steps. They can request a certain number of new parameter designs, enter the objective values for the new batch, update the model and data pool, and decide whether to performance more experiments according to the current performance of the model.

- Performance In order to test the app, I performance Bayesian Optimization on the protein directed evolution dataset to find the protein mutants with higher f itness and Active Regression on the buffer composition dataset to predict the yield of the cell free system with certain compositions.
As shown in the table below, the model was initialized with 100 randomly selected instances from the pool, and in each s ubsequent iteration, 20 new designs were queried. It can be seen that as performing more experiments according to the suggestions by the BO algorithm, the best objective value has increased from 1.90 to 4.43 after 5 batches.

The regression model training was performed on the buffer composition dataset. The model was first initiali zed on 50 randomly selected instances, and there were 50 in each of the subsequent batche s . T o examine the generalization ability of the trained model, after each iteration I tested the current model on all the other instances that have not been l earned by the model and recorded its r2 as testing performance. As shown in the following table, we can see after 5 iterations of queries (300 experiment evaluations), the model reached ~0.7 r2 on both training and testing sets , suggesting decent generaliza tion ability and accuracy.

From the preliminary testing results , it is shown that both objective optimization and regression model training tasks can be performed easily using this application, and the performances are comparable to those re p orted in the previous studies. W hile testing I noticed that the implementa tion by the modAL pac kage simply returns the top n batch size instances in the unlabeled pool after sorting t hem by utility or uncertainty and the scatter plo t showe d that they usually form a cluster in the design space, suggesting they a re very similar. I think thi s behavior may cause the batch experiments to become less eff icient when the pr ovided pool is dense since there is not enough divers ity in e ach batch and it may over e xpl oit or explore a certain reg ion in the design space by querying a cluster of very similar designs
In the future, I would like to make the BOARD support Membership Query Synthesis query strategy as well, so that th e users do not h ave to generate a poo l of all possible design s bu t rather only need to sp ecify the constrai nts for the pa rameters. In this way, it mak es mo re sense when there are continuous parameter s such that the users do not need to discre tize them and w o rr y ab out the d ensit y of the pool they created. Also , when suggesting the new batch of experiments, I may want to add a function such that the u ser can specify a diversity threshold so that designs in di fferent regions with relatively high utility u ncertain ty can be included in one batch, a nd hence help incre a se the efficiency of the training o r optimization process. The visualization of utility/ uncertainty in the unlabeled p o ol can a lso be further improved, in which the new batch of expe riments are highlighted, or the user can pick points to ad d to the new batch from the plot. Finally, for the regre ssion model training task, it would be very us eful to fi nd a way to al low the users to save the trained model locally and reuse it in the future.