You signed in with another tab or window. Reload to refresh your session.You signed out in another tab or window. Reload to refresh your session.You switched accounts on another tab or window. Reload to refresh your session.Dismiss alert
I am trying to plot Northern Europe in a specific projection(SWEREF-99).
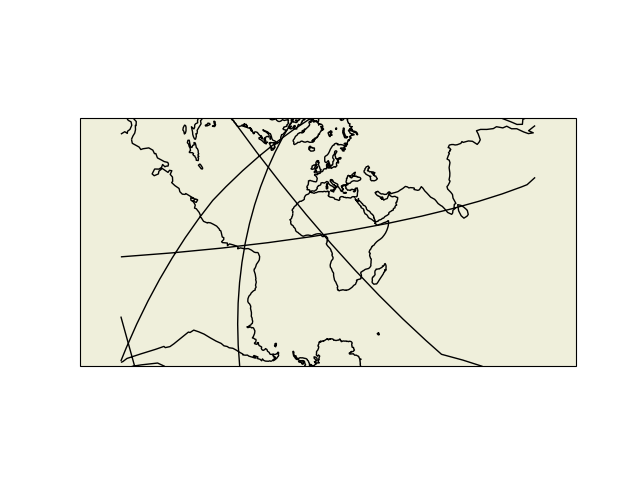
However, when changing the central_longitude argument of the TransverseMercator projection from 0 to specific numbers (e.g. 10), the Land and coastline features stop plotting correctly. The world is plotted as all land, and some of the coastline jumps across the map:
This Github issue stems from a Stackoverflow post where RuthC recommended I add an Issue here.
Code to reproduce
The code producing the image above:
import cartopy.crs as ccrs
import cartopy.feature as feature
import matplotlib.pyplot as plt

fig1 = plt.figure()
display_crs = ccrs.TransverseMercator(central_longitude=10)
ax = fig1.add_subplot(projection=display_crs)
ax.set_global()
ax.add_feature(feature.LAND)
ax.add_feature(feature.COASTLINE)
plt.show()
If the projection is not shifted it works perfectly:
import cartopy.crs as ccrs
import cartopy.feature as feature
import matplotlib.pyplot as plt

fig1 = plt.figure()
display_crs = ccrs.TransverseMercator(central_longitude=0)
ax = fig1.add_subplot(projection=display_crs)
ax.set_global()
ax.add_feature(feature.LAND)
ax.add_feature(feature.COASTLINE)
plt.show()
I am only interested in a smaller region (Northern Europe), so the coastline issues don't bother me as they don't occur there. However, the land is still not plotting correctly even when cropped:
import cartopy.crs as ccrs
import cartopy.feature as feature
import matplotlib.pyplot as plt

fig1 = plt.figure()
display_crs = ccrs.TransverseMercator(central_longitude=10)
ax = fig1.add_subplot(projection=display_crs)
ax.set_extent([2, 30, 54, 72], crs=ccrs.PlateCarree())
ax.add_feature(feature.LAND)
ax.add_feature(feature.COASTLINE)
plt.show()
Full environment definition
Cartopy version
0.23.0
The text was updated successfully, but these errors were encountered:
Description
I am trying to plot Northern Europe in a specific projection(SWEREF-99).
However, when changing the

central_longitudeargument of theTransverseMercatorprojection from 0 to specific numbers (e.g. 10), the Land and coastline features stop plotting correctly. The world is plotted as all land, and some of the coastline jumps across the map:This Github issue stems from a Stackoverflow post where RuthC recommended I add an Issue here.
Code to reproduce
The code producing the image above:
If the projection is not shifted it works perfectly:
I am only interested in a smaller region (Northern Europe), so the coastline issues don't bother me as they don't occur there. However, the land is still not plotting correctly even when cropped:
Full environment definition
Cartopy version
0.23.0
The text was updated successfully, but these errors were encountered: