| title | datePublished | cuid | slug | cover | ogImage | tags |
|---|---|---|---|---|---|---|
Day 75 - Sending Docker Log to Grafana |
Wed Feb 07 2024 14:47:19 GMT+0000 (Coordinated Universal Time) |
clsbwlpi6000009jrdlzpc4zv |
day-75-sending-docker-log-to-grafana |
cloud, monitoring, devops, loki, grafana, 90daysofdevops, promtail |
We learned how to install and start Grafana, set up Loki and Promtail via Docker, and configure Loki as a data source in Grafana.
Armed with these insights, you’re now well-prepared to navigate the world of efficient data visualization and comprehensive system monitoring. Stay tuned for more exciting explorations in our upcoming blogs!
For installation and Setup Grafana Server
Checkout my 73 day blog. "Grafana Installation"
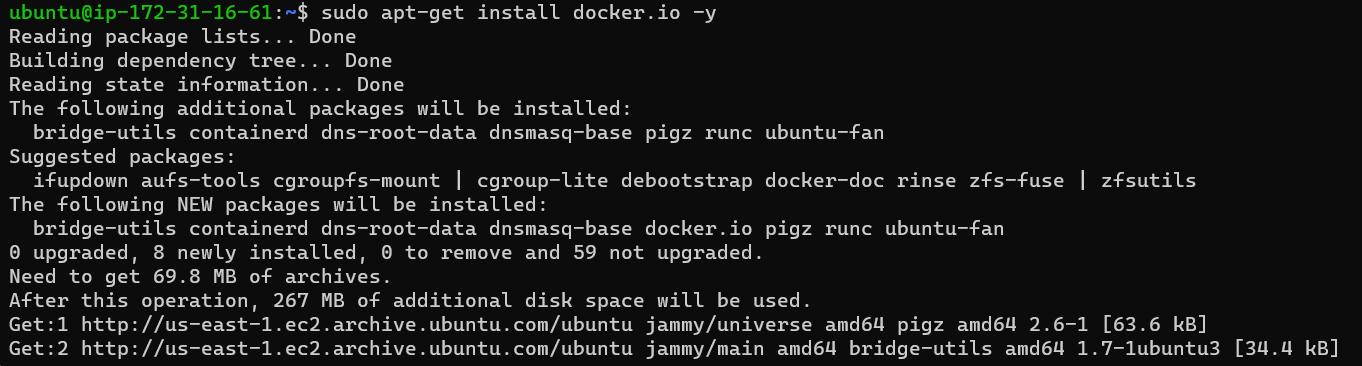
- Before installing Loki & Promtail make sure you have docker installed in your instance.
sudo apt-get update

sudo apt-get install docker.io -y

 # Giving docker permission to current user
  sudo usermod -aG docker $USER
  sudo reboot
# verfiy the installation of docker
  docker --version

sudo systemctl enable docker
sudo systemctl start docker
sudo systemctl docker status


-
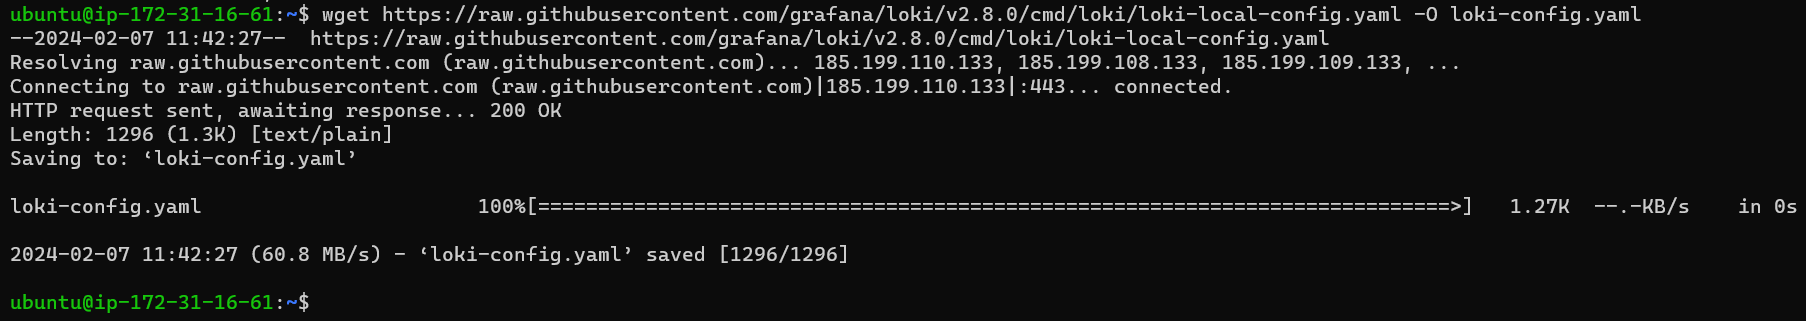
Download the Loki Config file into your current directory.
-
wget https://raw.githubusercontent.com/grafana/loki/v2.8.0/cmd/loki/loki-local-config.yaml -O loki-config.yaml
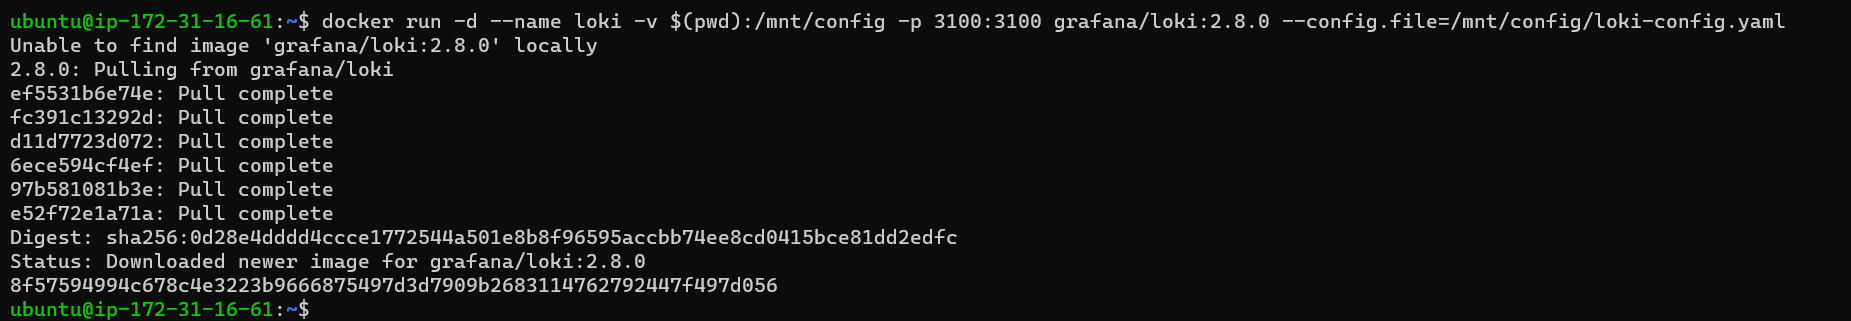
- Run the Loki container using the following Docker command.
docker run -d --name loki -v $(pwd):/mnt/config -p 3100:3100 grafana/loki:2.8.0 --config.file=/mnt/config/loki-config.yaml
-
We can verify Loki is running using the docker container by using the following Docker command :
-
docker ps
-
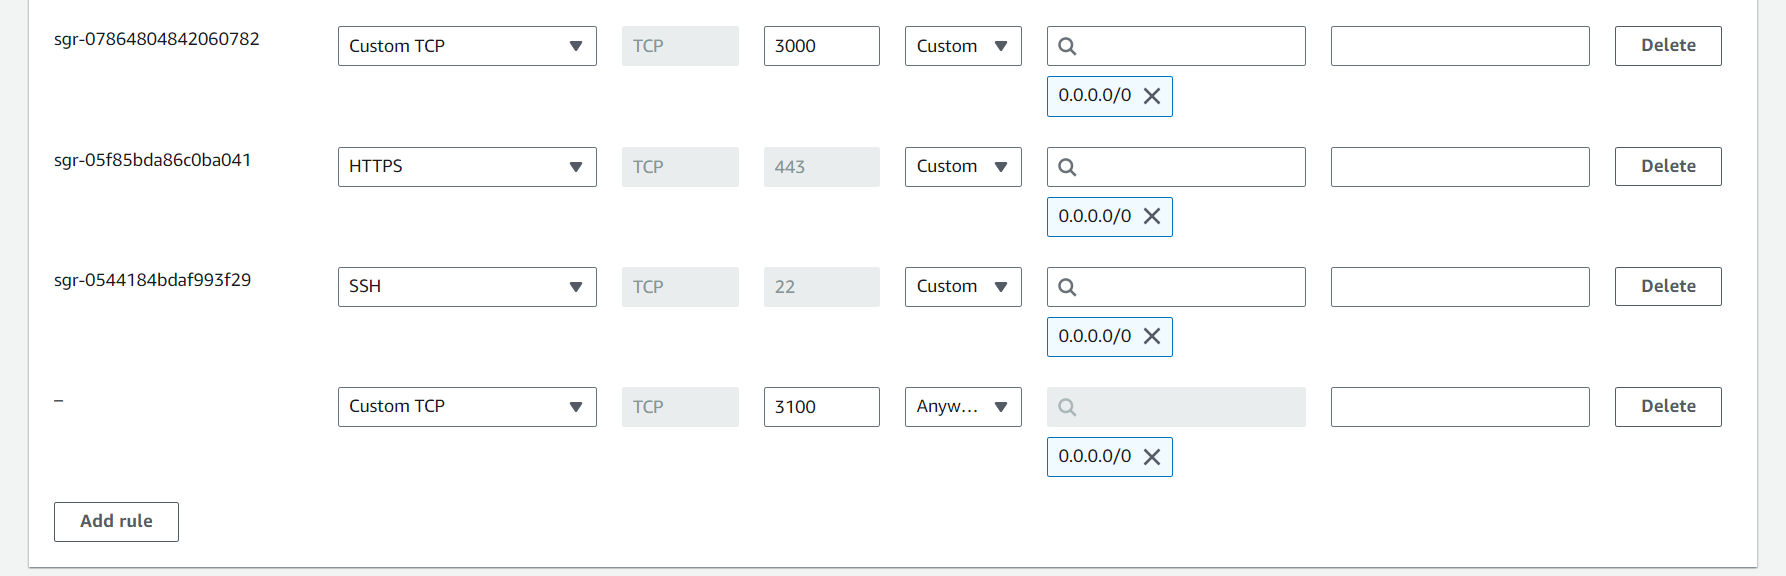
Now to access Loki, Go to the Security Group of your EC2 instance and add port 3100.
-

-
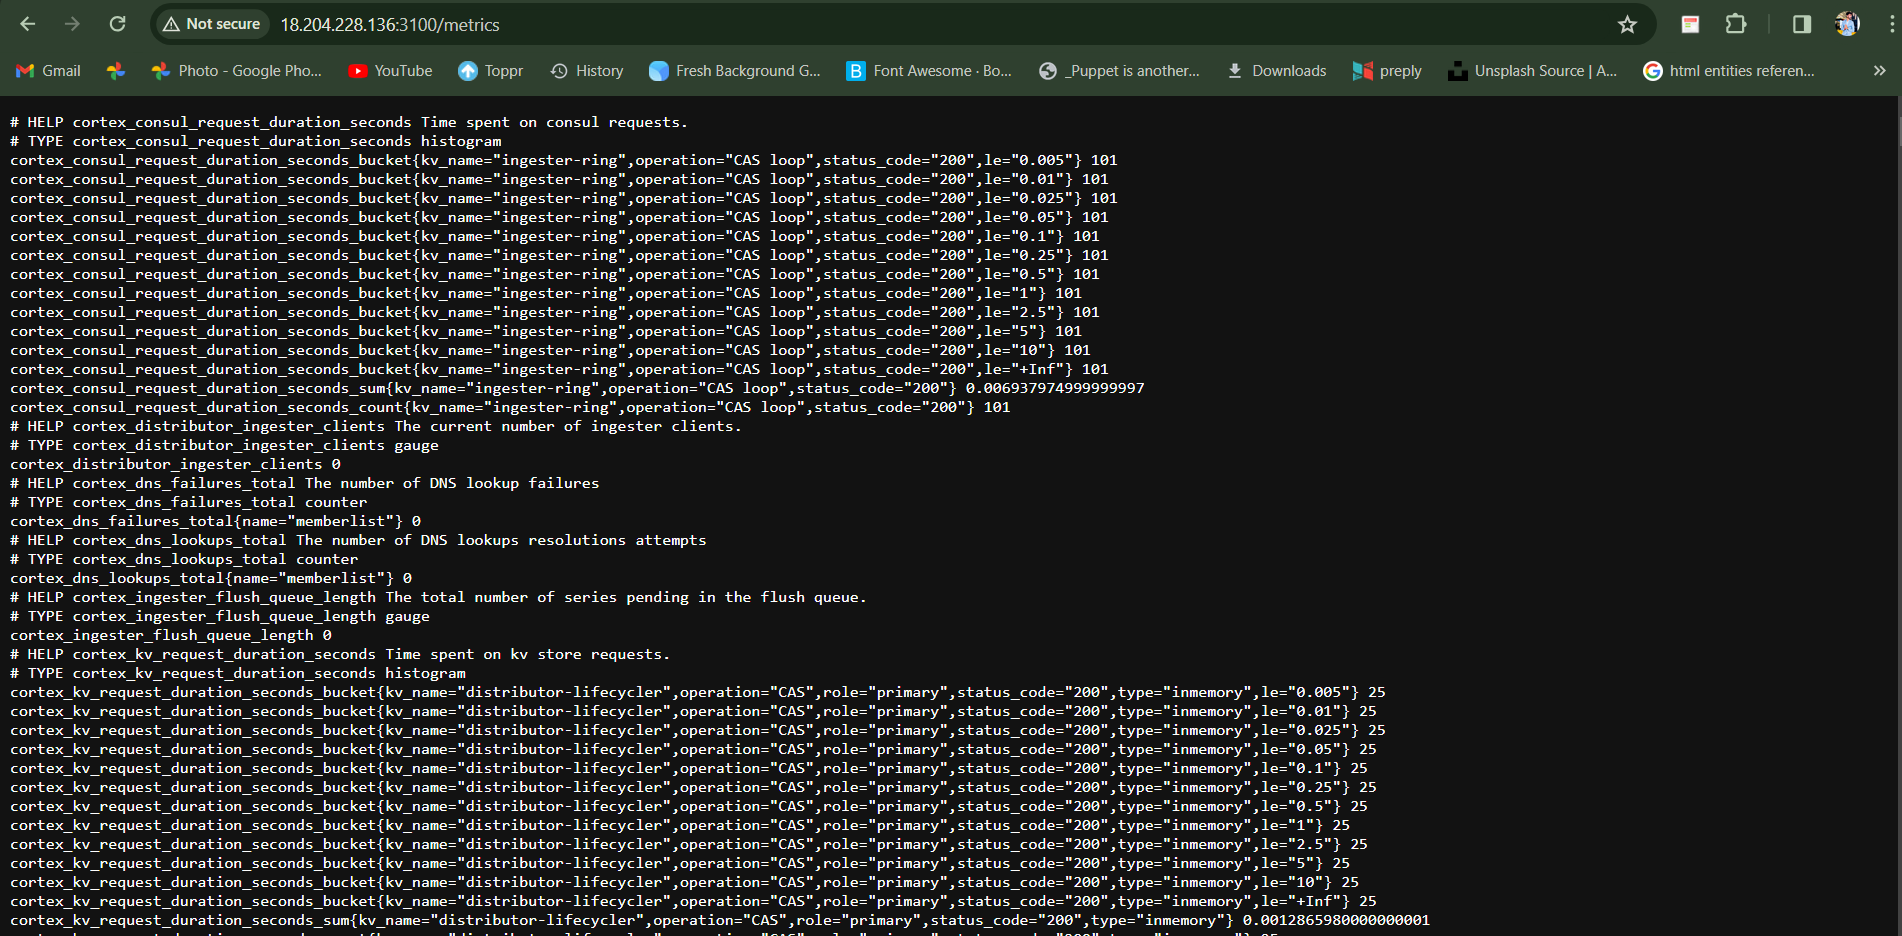
We can see Loki’s metrics using the IPv4 address followed by port 3100 and metrics.
-
http://<public_ipV4>:3100/metrics
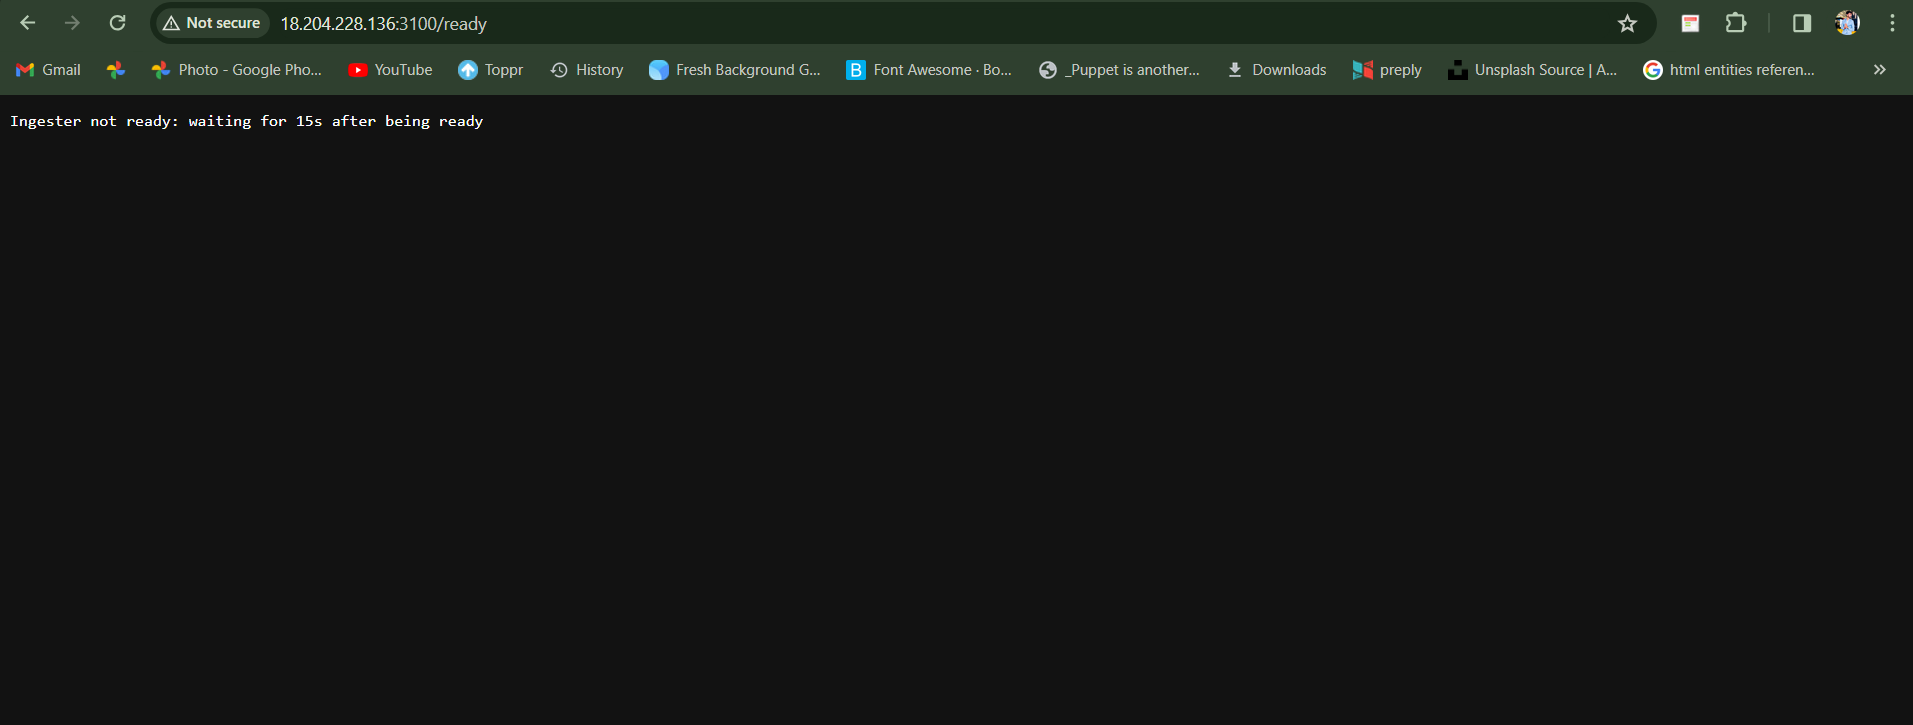
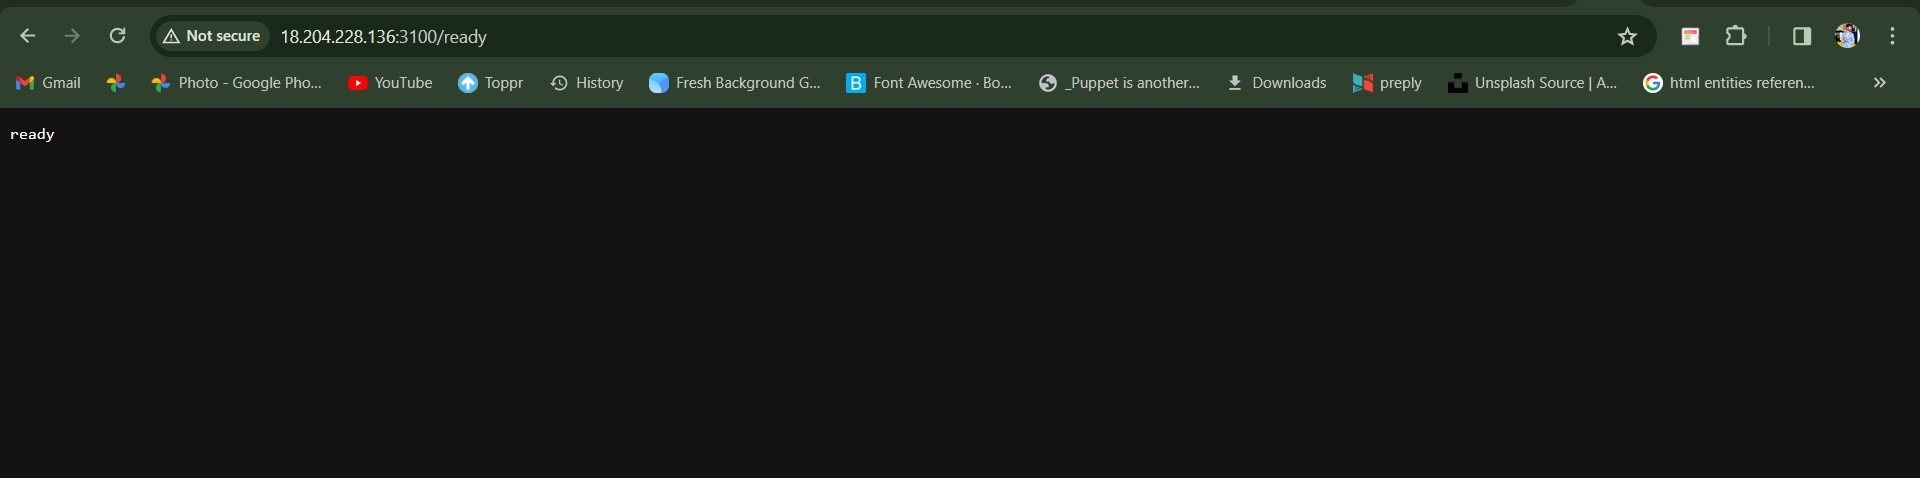
- To verify whether Loki is ready or not, access the IPv4 address followed by port 3100 and ready.
http://public_ipV4:3100/ready

-
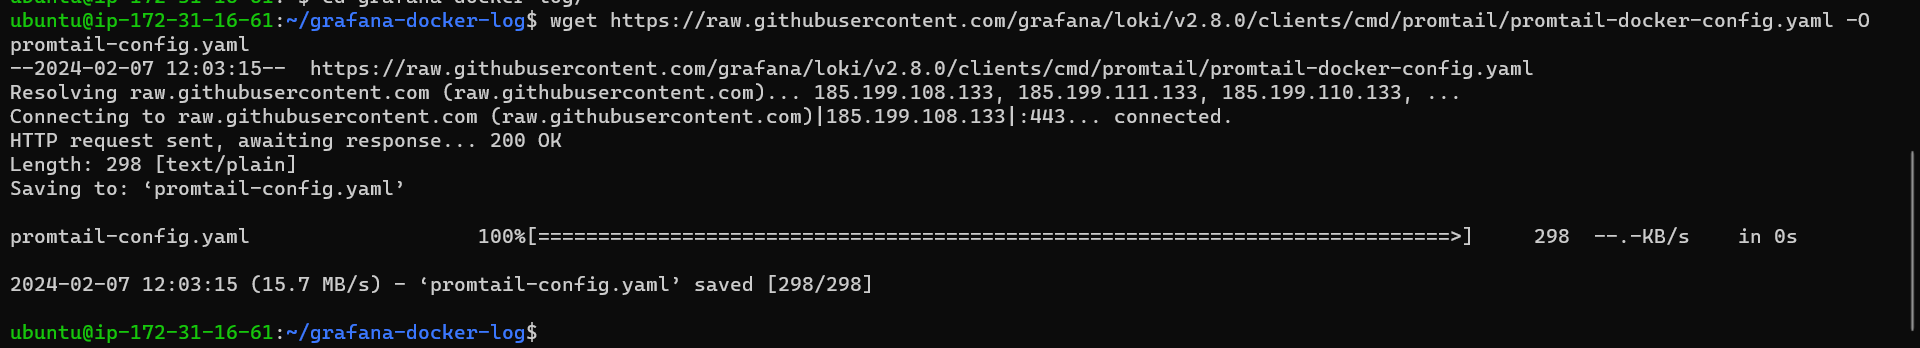
Now download the Promtail Config yaml file into your directory by using the following command:
-
wget https://raw.githubusercontent.com/grafana/loki/v2.8.0/clients/cmd/promtail/promtail-docker-config.yaml -O promtail-config.yaml-

-
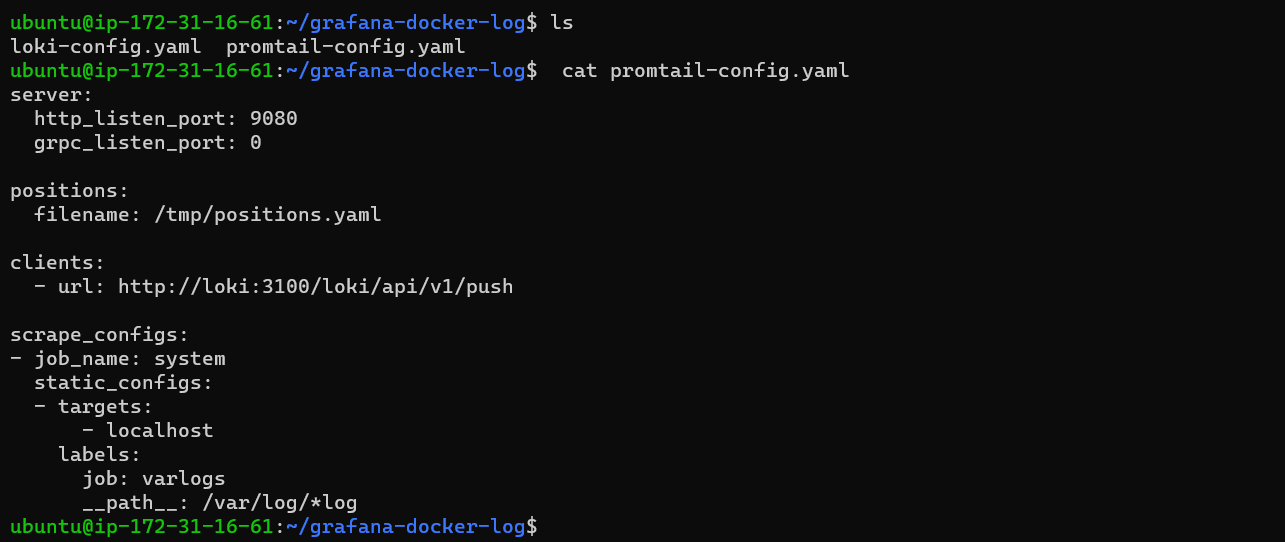
We can verify Promtail configuration file is there in the directory by using the following command:
ls cat promtail-config.yaml-

-
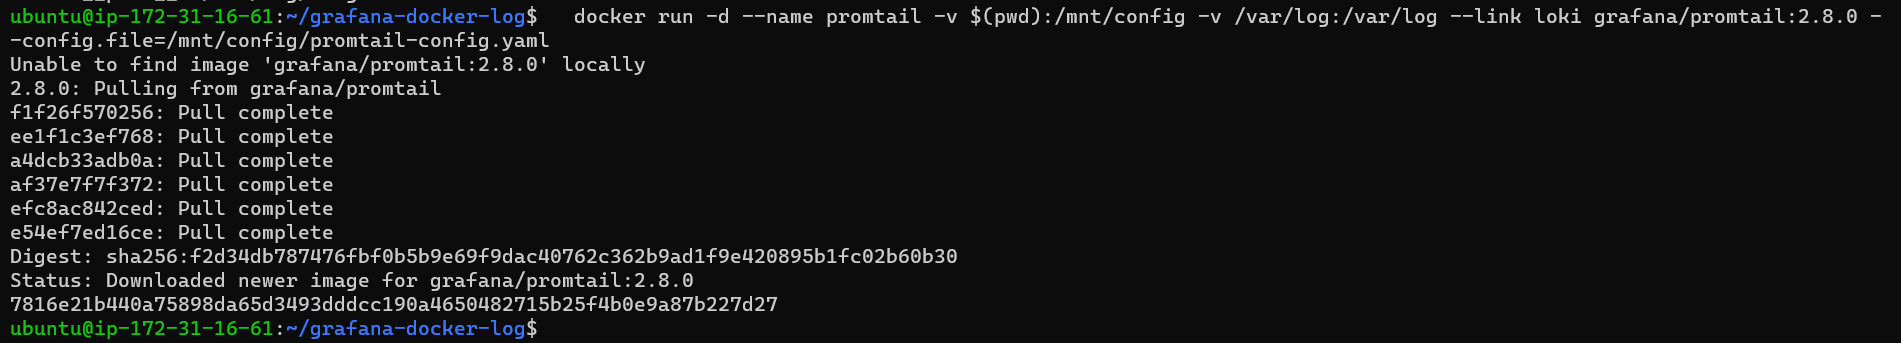
Now execute the Promtail container by using the following Docker command:
docker run -d --name promtail -v $(pwd):/mnt/config -v /var/log:/var/log --link loki grafana/promtail:2.8.0 --config.file=/mnt/config/promtail-config.yaml
-
We can verify both Loki and Promtail are running using
docker pscommand. -
docker ps
-
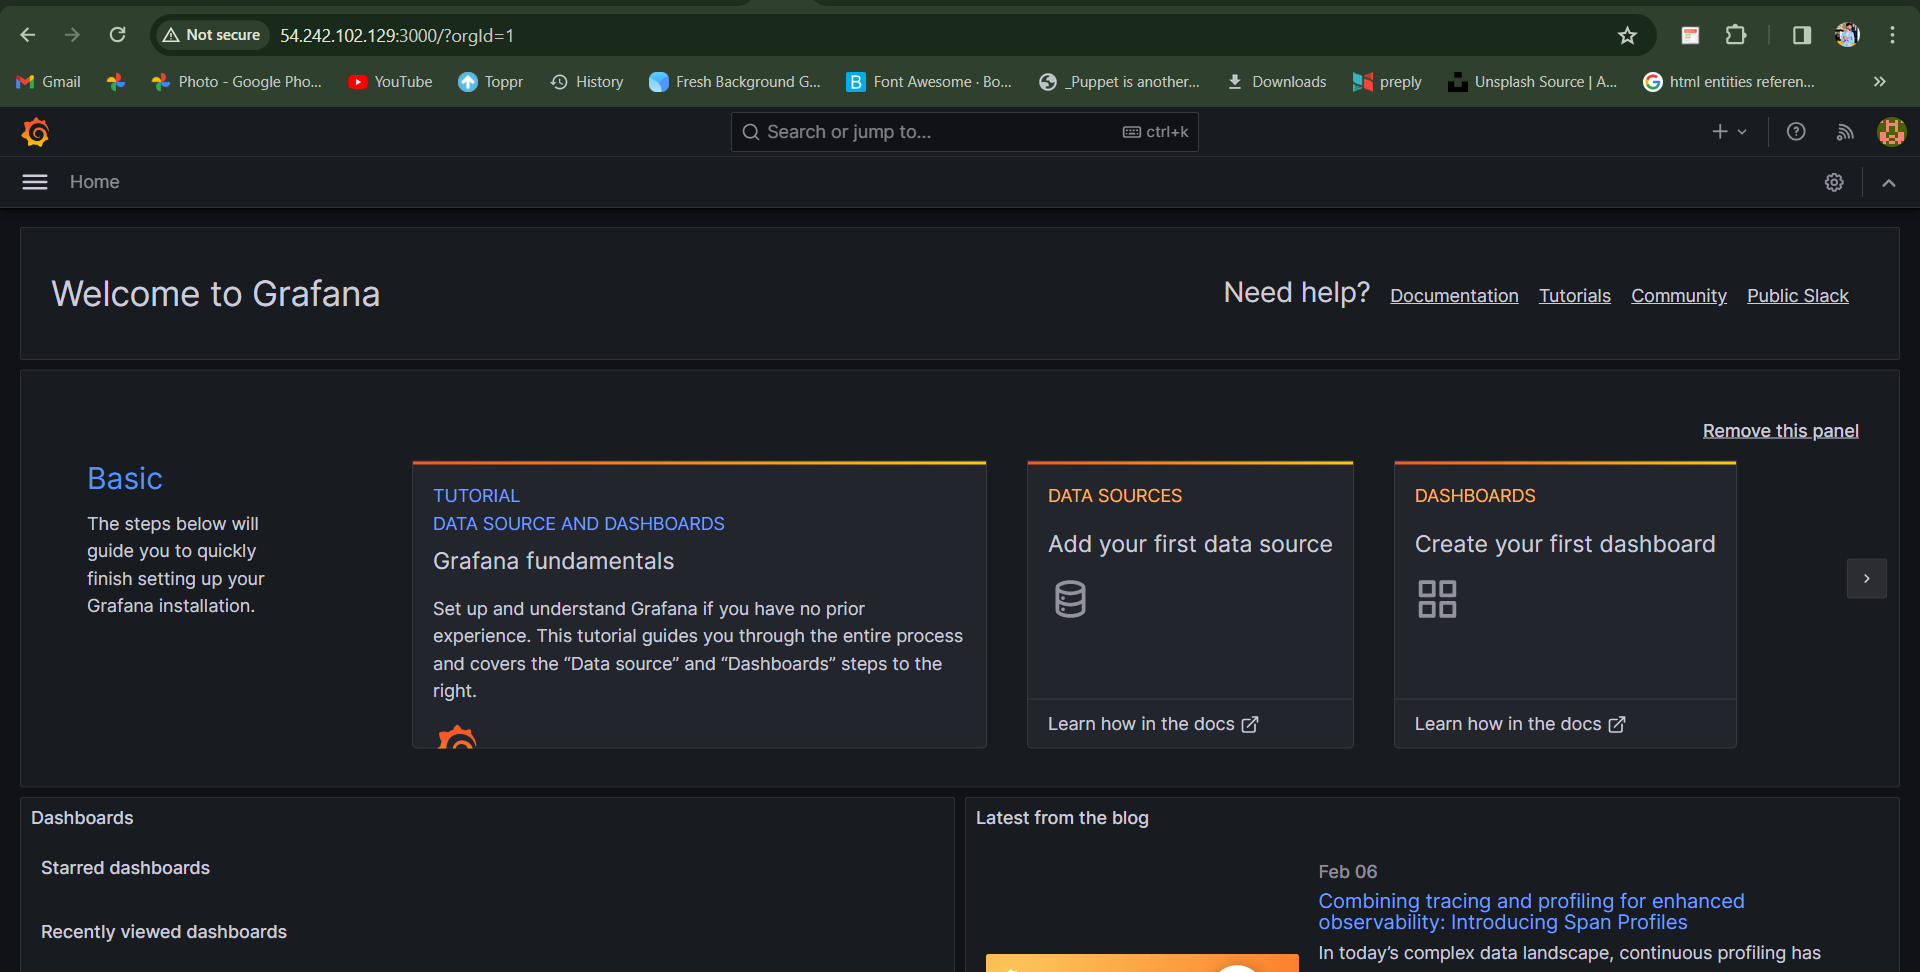
Once both Loki and Promtail are configured in the instance, Login to the Grafana Home Page
-

-
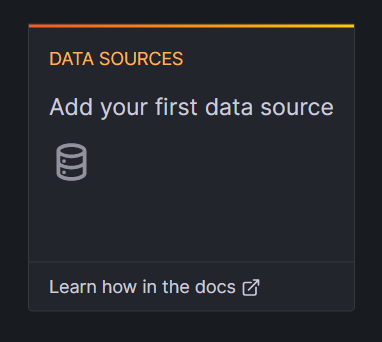
In the navigation drawer either there is DataSource click on it or you can get it by clicking on the left hamburger menu, hovering over there is a gear icon (second last one) and clicking on “Data Sources”.
-

Click on “Add data source” and search for “Loki”. Click on it.
-

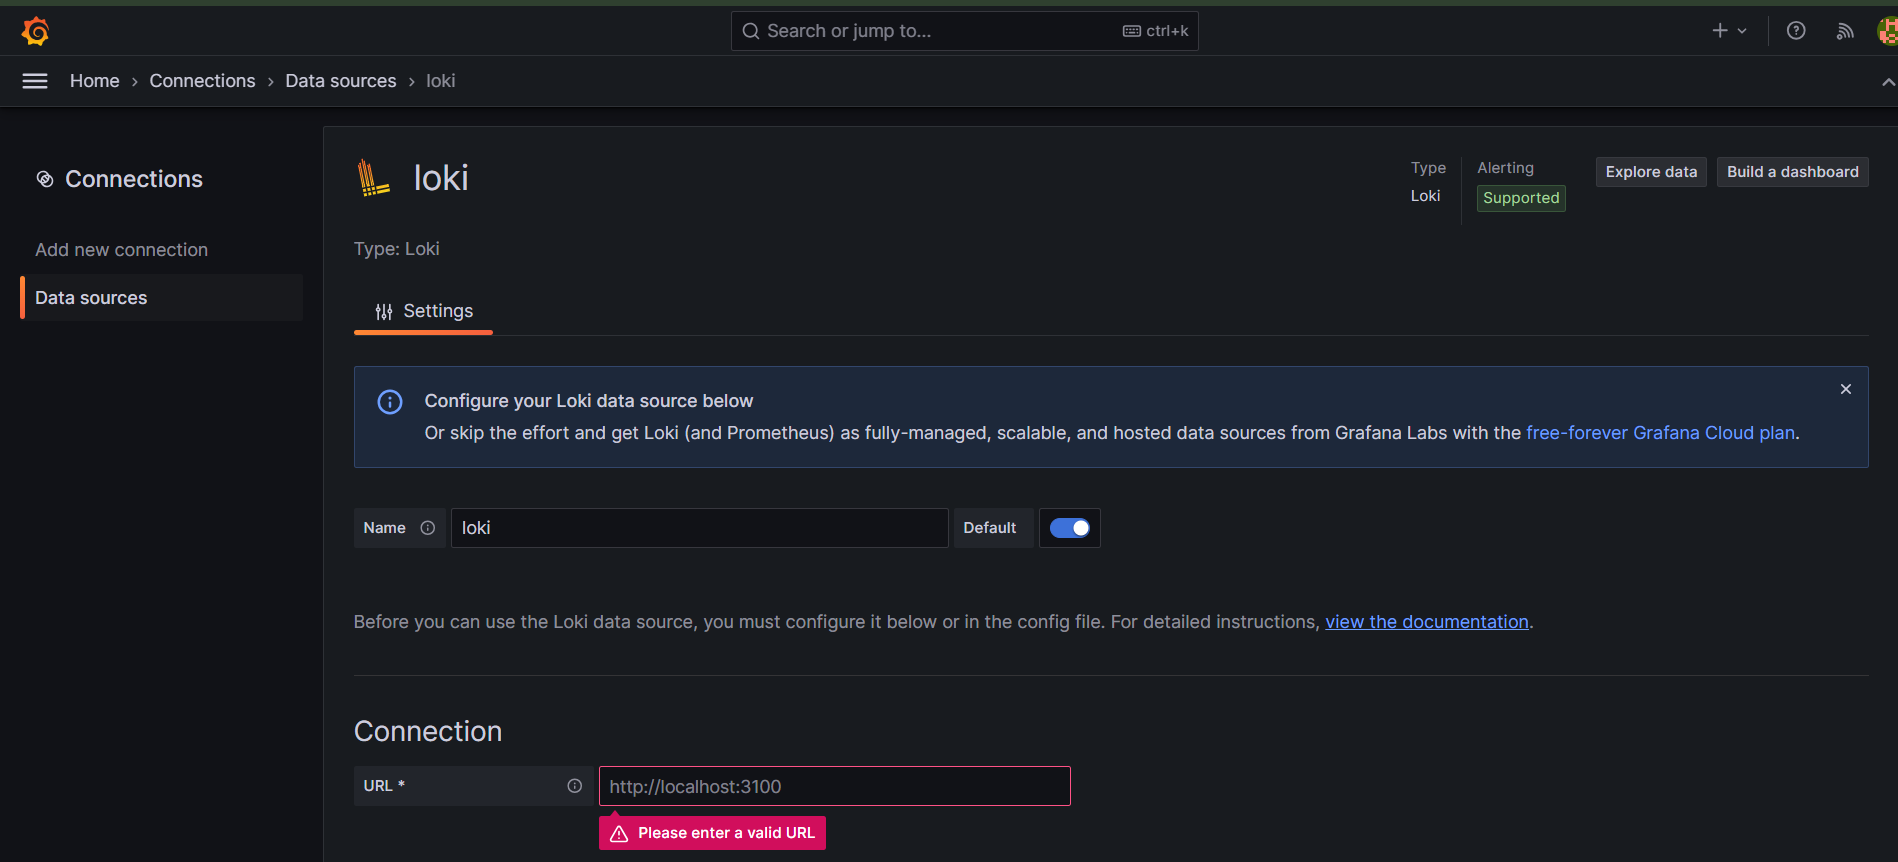
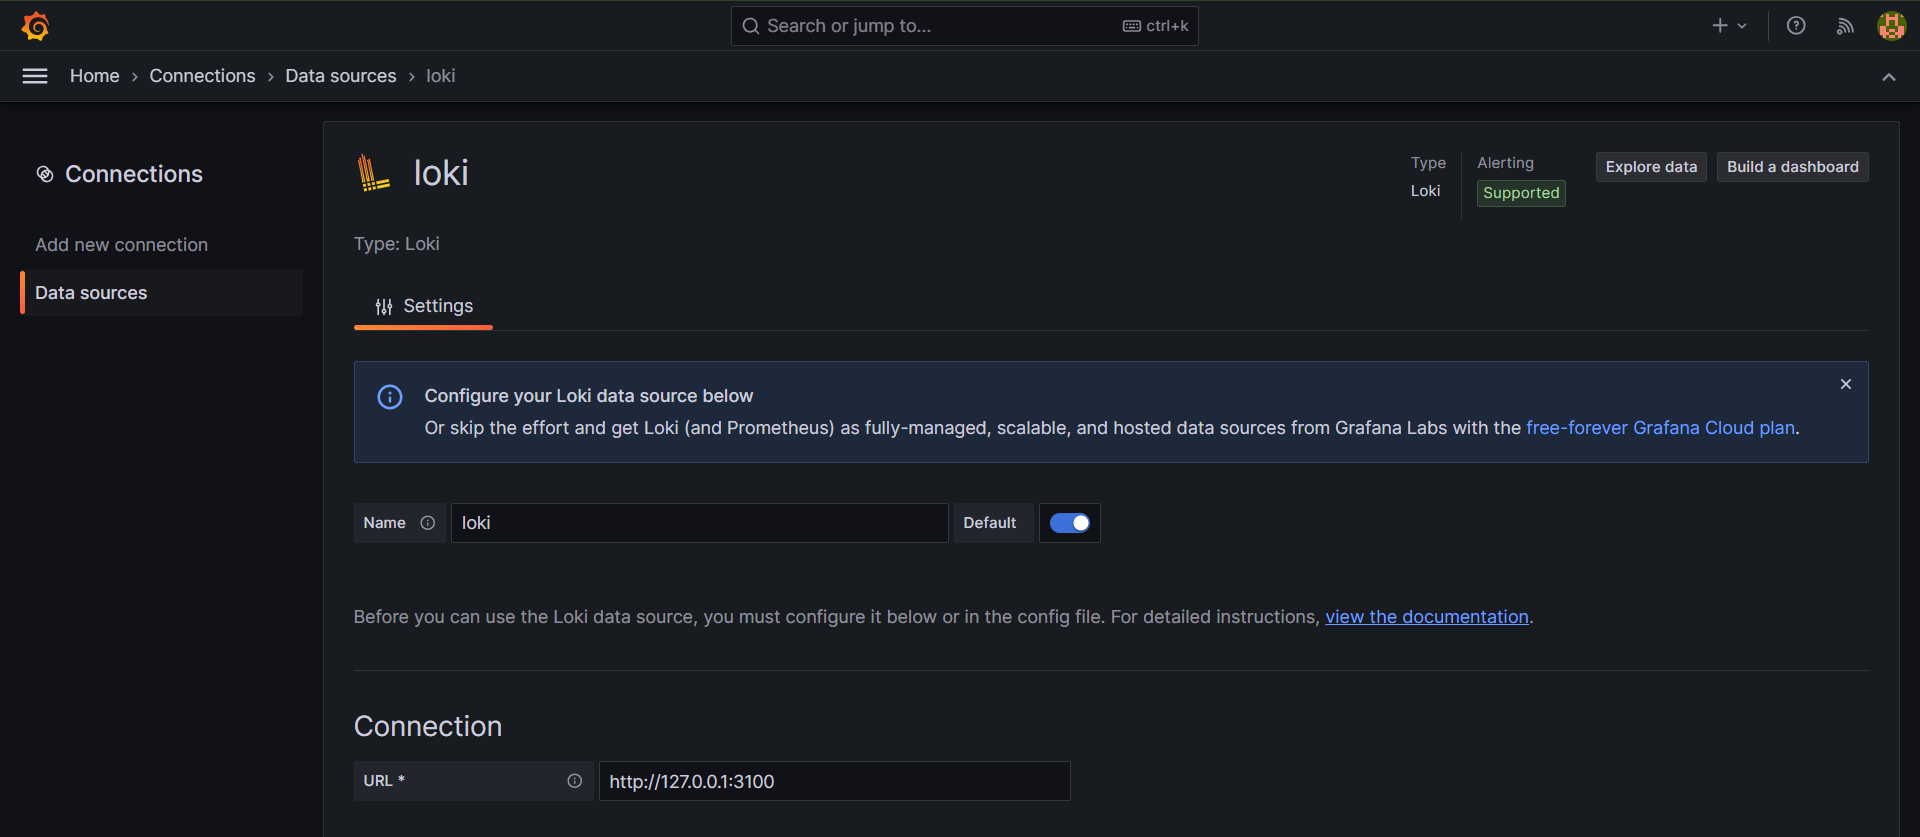
- As the Loki prompt is opened fill in the details like Name and in the HTTP provide the URL i.e, http://127.0.0.1:3100

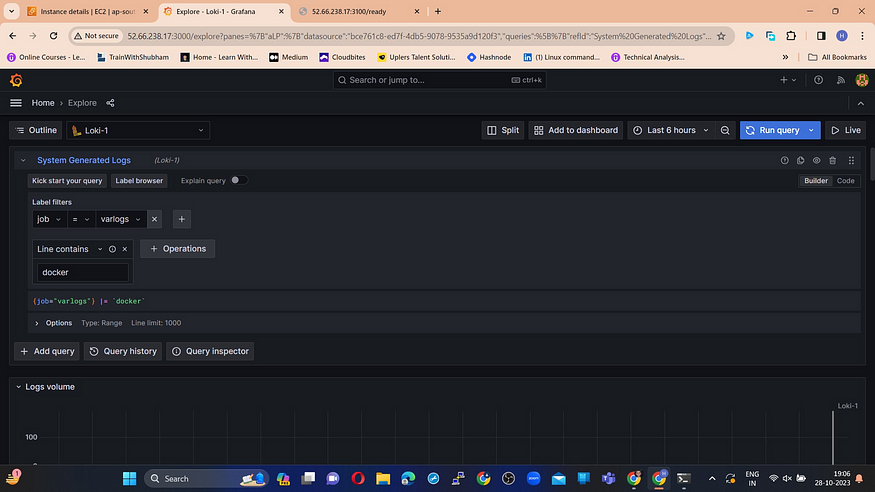
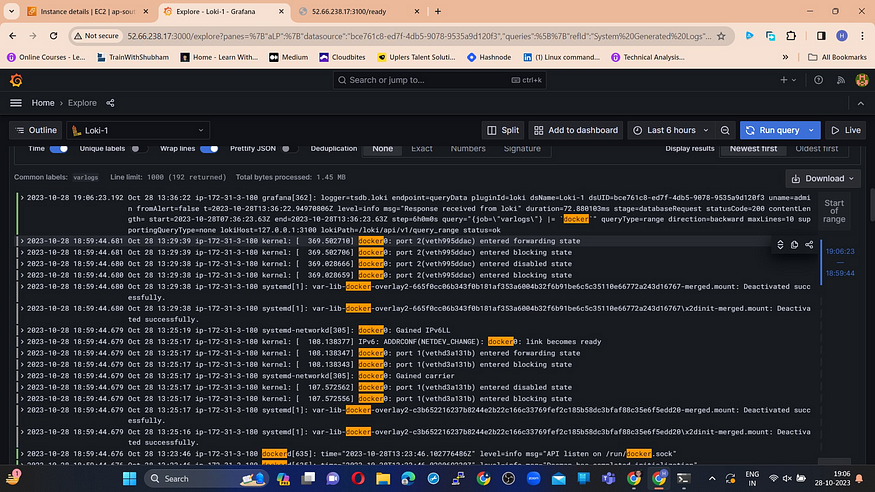
- We will create metrics that will show logs containing Docker in it.
  Name -> System Generated Logs
  Label Filters -> jobs, varlogs
  Line Contains -> docker

-
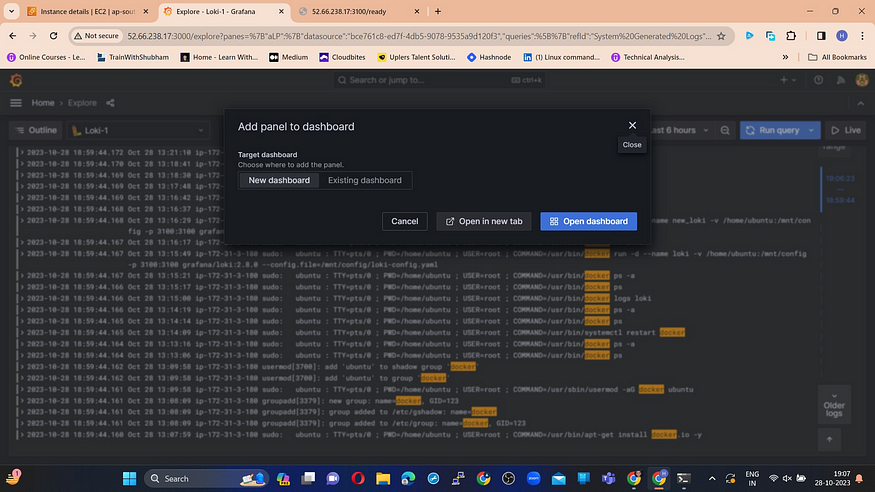
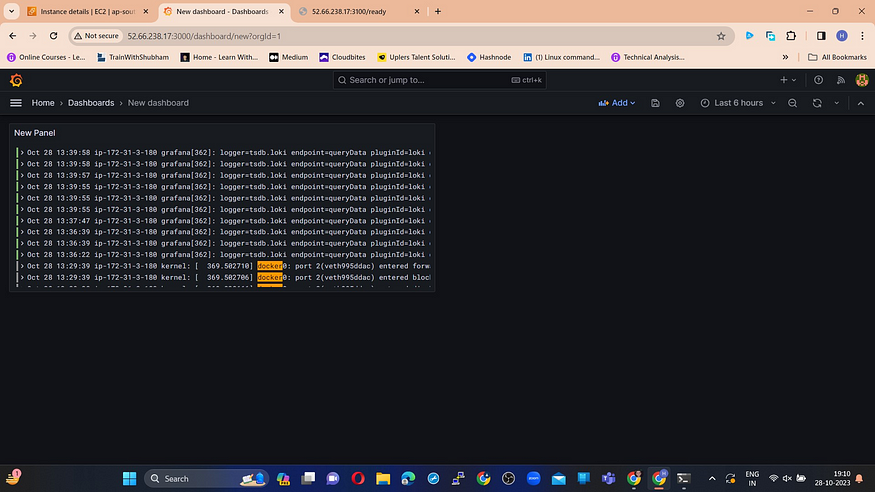
Once you get the output we can put the result into a new dashboard, before that named it.
-


Thanks for delving into Grafana, Loki, and Promtail through Docker installation! Now equipped with powerful monitoring tools, from Grafana setup to Loki and Promtail configuration, you’re ready for efficient system monitoring and visualization.
-
Hope you found this helpful.
Embrace the challenges ahead and stay excited for continued growth and learning!So I encourage you to try this on your own and let me know in the comment section about your learning experience
Thank you for reading!
Thank You! Stay Connected ☁️👩💻🌈
Contact me at :
LinkedIn: linkedin.com/in/akash-singh-48689a176
E-mail: [email protected]/[email protected]
-
-