The best thing about React and Redux is that it simplifies the development workflow.
Generally speaking, code belongs in one of four buckets: component, action, reducer, or client.
There are different strategies for debugging each bucket, which we'll outline below.
Also, because the Debugger is just a web page, all of your web development debugging strategies will carry over as well.
The first thing you want to find the component to work on. The react devtools extension is useful for finding the correct component.
Once you find the component, check the component's state and props and monitor the render calls. The easiest way to do this is to add a breakpoint in the render function.
Actions are the Debugger's API for adding breakpoints, stepping, and everything else.
Sometimes you want to know how to invoke an action or figure out why it's not working. Sometimes you want to understand why the state is what it is and what actions have occurred.
A good place to start is logging. You can log the Debugger's actions by enabling logging.actions in your local config. You can also use Redux's devtools to see the actions that are invoked and how they updated the state.
Once you've narrowed the question down to an action you can debug it either in the console or unit tests.
It's easy to try invoking an action in the console with the dbg helper:
dbg.actions.selectLocation();We have unit tests for several of our actions in src/actions/tests.
It's nice to look at the unit tests to see how an action should be called. If you don't see the use case you're looking for, add a unit test to try it out. Once you get it working you can PR the new unit test and everyone benefits :)
It's really common to want to know what data the Debugger has. For instance, what does a breakpoint look like? In Redux, the reducers are like the application database and it's tremendously useful to be able to inspect them.
It's easy to view the current Debugger state in the console with
the dbg global. Because the store is immutable, you'll need to request the state each time you want to see it.
dbg.store.getState().sources.toJS();You can also test out a selector in the console with the `dbg helper:
dbg.selectors.getBreakpoints();Perhaps, the most interesting question you can ask about the Debugger is how does it work? This question often takes the form of, "how is a breakpoint added?" or "what happens when the debugger pauses?".
To answer these questions, you need to look at the Debugger's client, which talks to the server over a websocket.
The client commands are available on the console at client for testing purposes:
dbg.client.setBreakpoint(...) // will add a breakpoint
dbg.client.resume() // will resume when paused
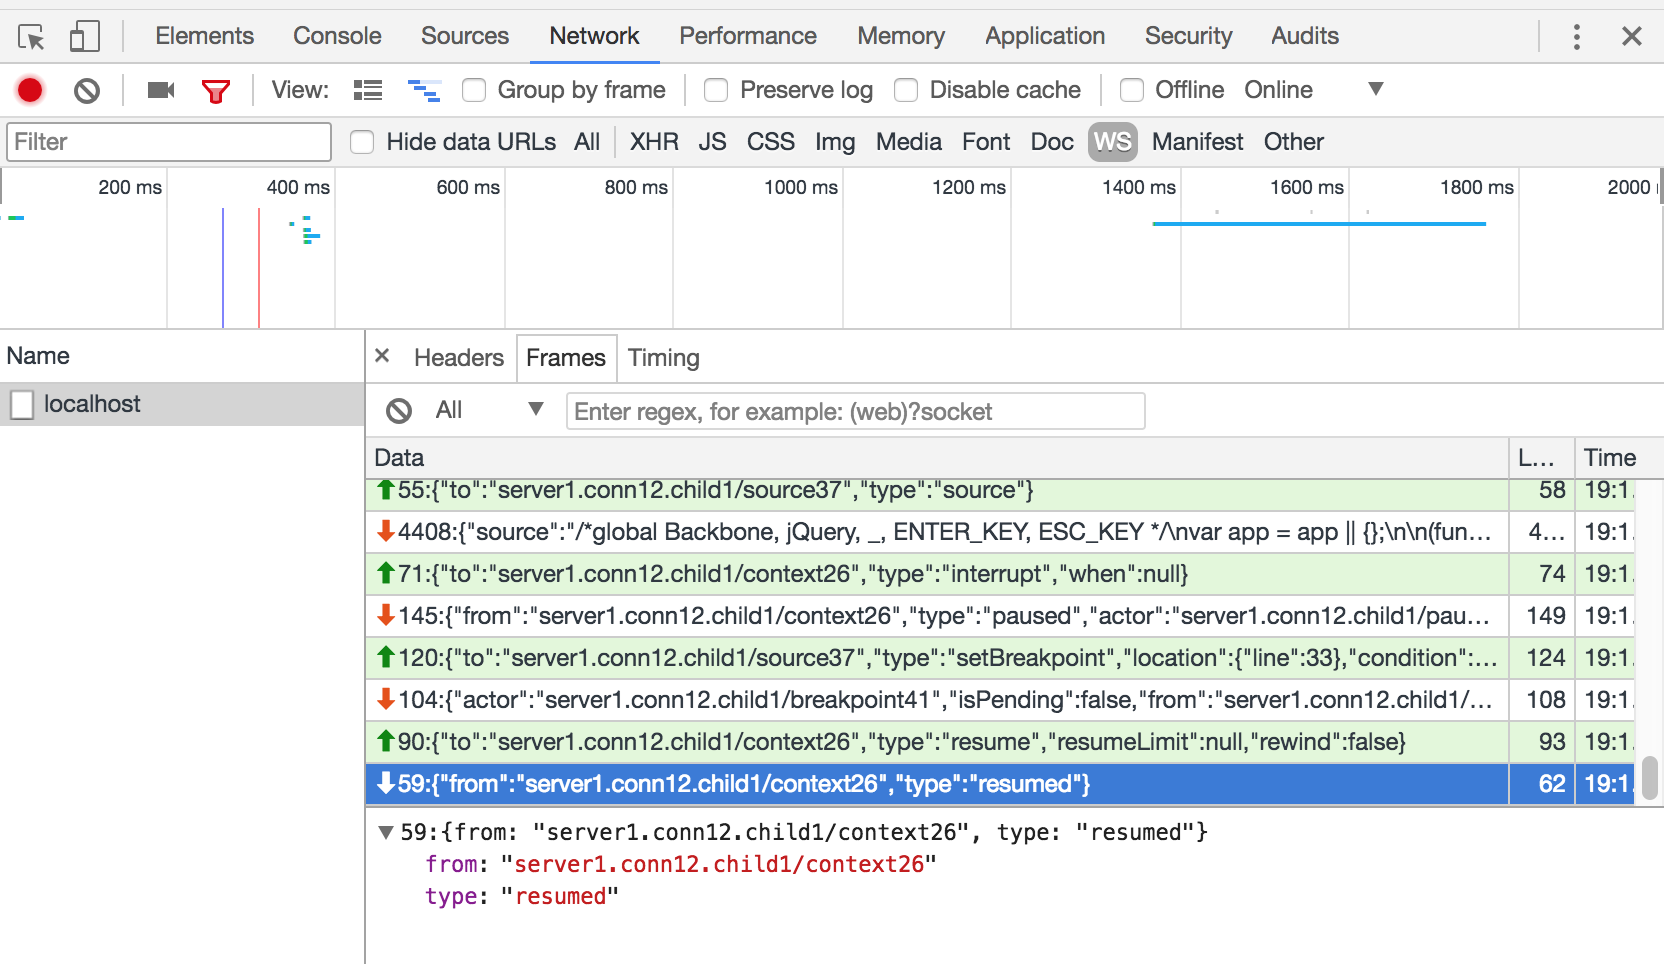
The best way to see what the client does is the view the communication over the websocket.
Here's a sample of some websocket frames from the Debugger attaching:
{"to":"server2.conn7.child1/27","type":"attach","options":{}}
{"from":"server2.conn7.child1/27","type":"paused","actor":"server2.conn7.child1/pause28","poppedFrames":[],"why":{"type":"attached"}}
{"to":"server2.conn7.child1/27","type":"resume","resumeLimit":null}
{"from":"server2.conn7.child1/27","type":"resumed"}	54
{"from":"server2.conn7.child1/tab1","type":"newSource","source":{"actor":"server2.conn7.child1/29","generatedUrl":null,"url":"http://localhost:7999/mutating.html","isBlackBoxed":false,"isPrettyPrinted":false,"isSourceMapped":false,"sourceMapURL":null,"introductionUrl":null,"introductionType":null}}
{"from":"server2.conn7.child1/27","type":"newSource","source":{"actor":"server2.conn7.child1/29","generatedUrl":null,"url":"http://localhost:7999/mutating.html","isBlackBoxed":false,"isPrettyPrinted":false,"isSourceMapped":false,"sourceMapURL":null,"introductionUrl":null,"introductionType":null}}
{"sources":[{"actor":"server2.conn7.child1/29","generatedUrl":null,"url":"http://localhost:7999/mutating.html","isBlackBoxed":false,"isPrettyPrinted":false,"isSourceMapped":false,"sourceMapURL":null,"introductionUrl":null,"introductionType":null}],"from":"server2.conn7.child1/27"}
{"to":"server2.conn7.child1/29","type":"source"}
Chrome has a useful websocket monitor for viewing the communication:
Lastly, it's worth mentioning that Developer Tools are an advanced subject you're actually inquiring into how JS works. It's awesome that you're curious and there are lots of people in our Slack channel who are learning alongside of you.
The best thing to do is to join our Slack and share what you're learning and ask others questions. They'll be plenty of people who are curious and happy to share what they know. Also, down the road, this is a subject that plenty of people are interested in learning and great fodder for talks.


