Netdata offers two ways to receive alarm notifications on external platforms. These methods work independently or in parallel, which means you can enable both at the same time to send alarm notifications to any number of endpoints.
Both methods use a node's health alarms to generate the content of alarm notifications. Read the doc on configuring alarms to change the preconfigured thresholds or to create tailored alarms for your infrastructure.
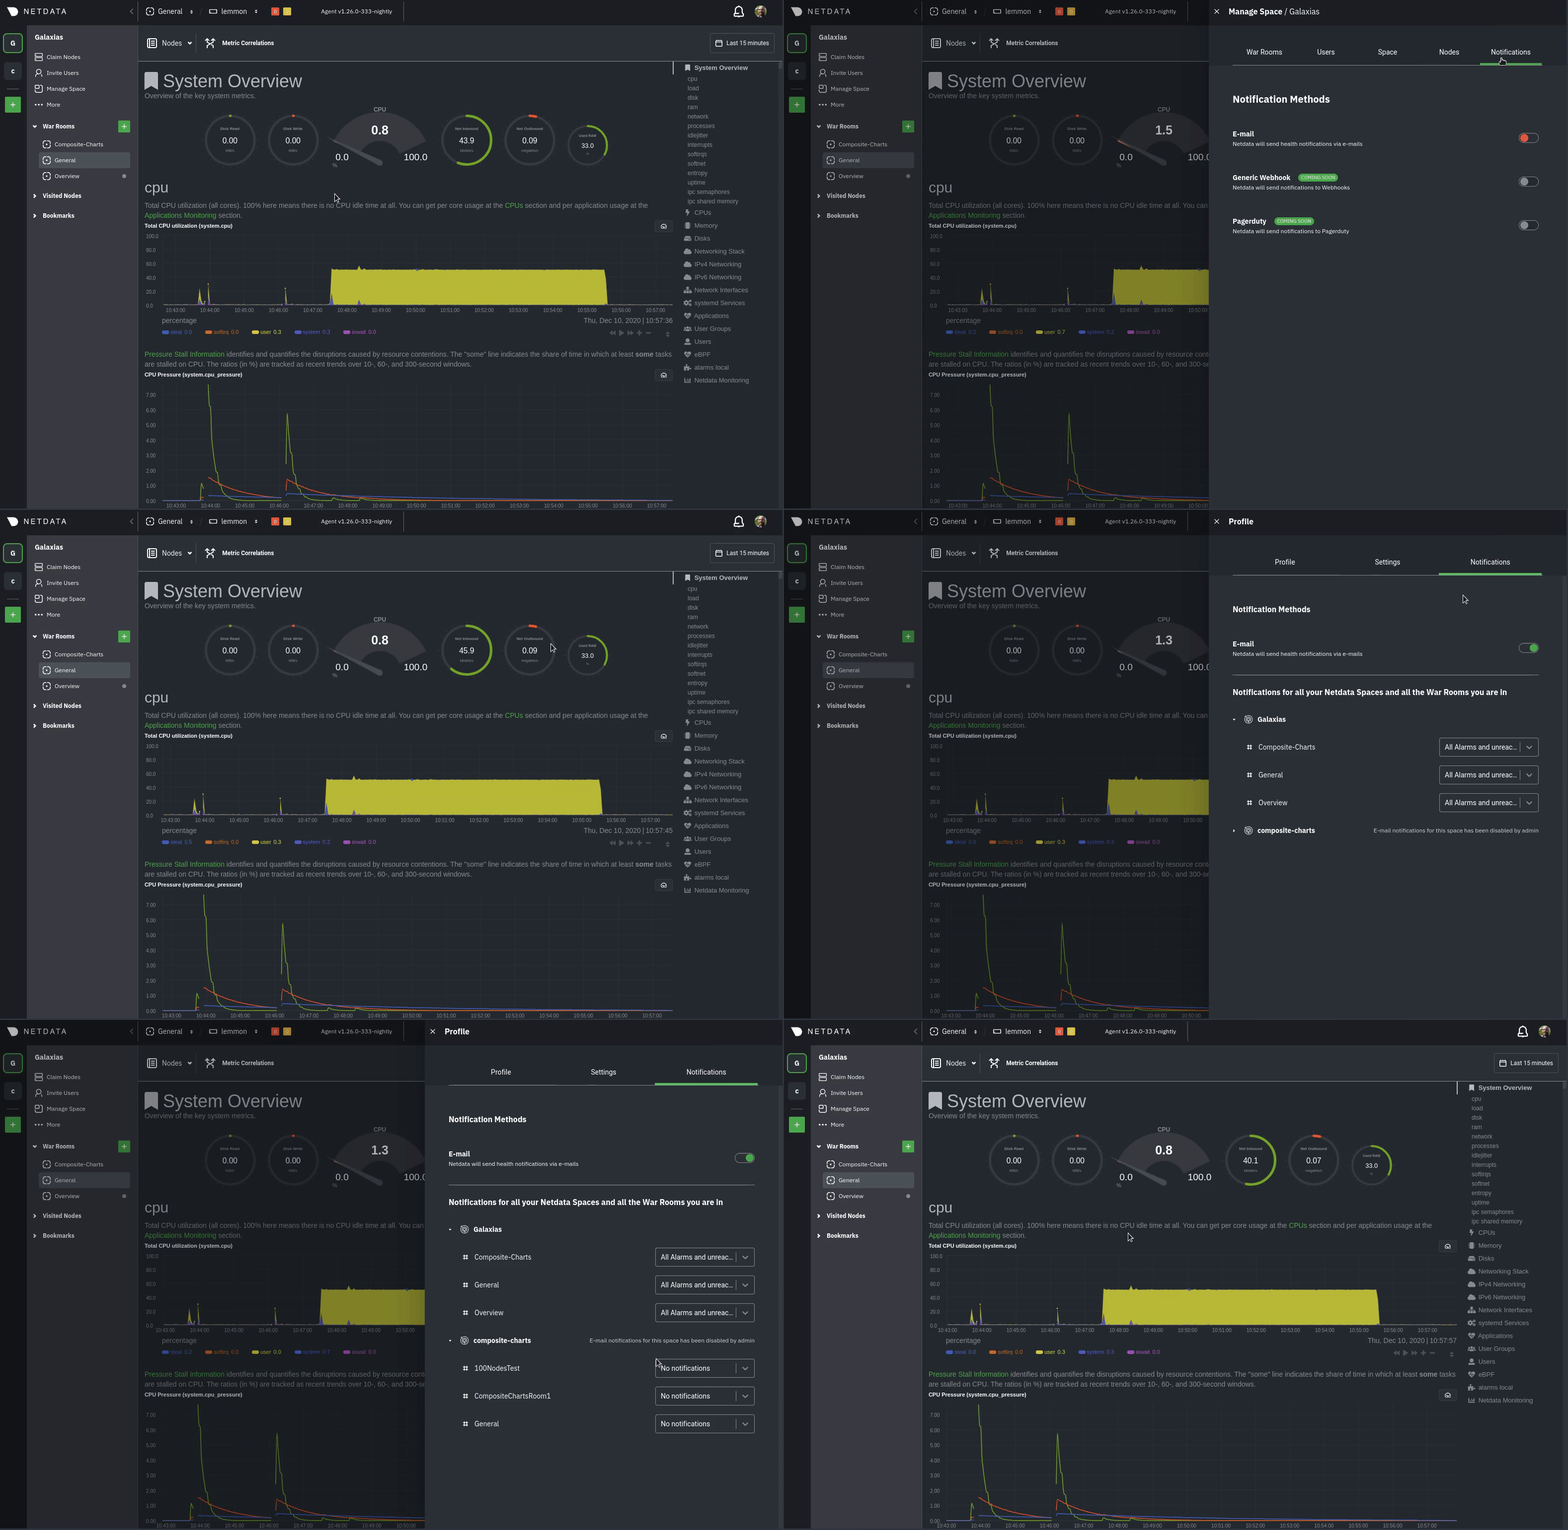
Netdata Cloud offers centralized alarm notifications via email, which leverages the health status information already streamed to Netdata Cloud from connected nodes to send notifications to those who have enabled them.
The Netdata Agent has a notification system that supports more than a dozen services, such as email, Slack, PagerDuty, Twilio, Amazon SNS, Discord, and much more.
For example, use centralized alarm notifications in Netdata Cloud for immediate, zero-configuration alarm notifications for your team, then configure individual nodes send notifications to a PagerDuty endpoint for an automated incident response process.
Netdata Cloud's centralized alarm notifications is a zero-configuration way to get notified when an anomaly or incident strikes any node or application in your infrastructure. The advantage of using centralized alarm notifications from Netdata Cloud is that you don't have to worry about configuring each node in your infrastructure.
To enable centralized alarm notifications for a Space, click on Manage Space in the left-hand menu, then click on the Notifications tab. Click the toggle switch next to E-mail to enable this notification method.
Next, enable notifications on a user level by clicking on your profile icon, then Profile in the dropdown. The Notifications tab reveals rich management settings, including the ability to enable/disable methods entirely or choose what types of notifications to receive from each War Room.
See the centralized alarm notifications reference doc for further details about what information is conveyed in an email notification, flood protection, and more.
The Netdata Agent's notification system runs on every node and dispatches notifications based on configured endpoints and roles. You can enable multiple endpoints on any one node and use Agent notifications in parallel with centralized alarm notifications in Netdata Cloud.
❗ If you want to enable notifications from multiple nodes in your infrastructure, each running the Netdata Agent, you must configure each node individually.
Below, we'll use Slack notifications as an example of the process of enabling any notification platform.
- alerta.io
- Amazon SNS
- Custom endpoint
- Discord
- Dynatrace
- Flock
- Google Hangouts
- IRC
- Kavenegar
- Matrix
- Messagebird
- Microsoft Teams
- Netdata Agent dashboard
- Opsgenie
- PagerDuty
- Prowl
- PushBullet
- PushOver
- Rocket.Chat
- Slack
- SMS Server Tools 3
- StackPulse
- Syslog
- Telegram
- Twilio
First, Add an incoming webhook in Slack for the channel where you want to see alarm notifications from Netdata. Click the green Add to Slack button, choose the channel, and click the Add Incoming WebHooks Integration button.
On the following page, you'll receive a Webhook URL. That's what you'll need to configure Netdata, so keep it handy.
Navigate to your Netdata config directory and use edit-config to
open the health_alarm_notify.conf file:
sudo ./edit-config health_alarm_notify.confLook for the SLACK_WEBHOOK_URL=" " line and add the incoming webhook URL you got from Slack:
SLACK_WEBHOOK_URL="https://hooks.slack.com/services/XXXXXXXXX/XXXXXXXXX/XXXXXXXXXXXX"
A few lines down, edit the DEFAULT_RECIPIENT_SLACK line to contain a single hash # character. This instructs Netdata
to send a notification to the channel you configured with the incoming webhook.
DEFAULT_RECIPIENT_SLACK="#"
To test Slack notifications, switch to the Netdata user.
sudo su -s /bin/bash netdataNext, run the alarm-notify script using the test option.
/usr/libexec/netdata/plugins.d/alarm-notify.sh testYou should receive three notifications in your Slack channel for each health status change: WARNING, CRITICAL, and
CLEAR.
See the Agent Slack notifications doc for more options and information.
Now that you have health entities configured to your infrastructure's needs and notifications to inform you of anomalies or incidents, your health monitoring setup is complete.
To make your dashboards most useful during root cause analysis, use Netdata's distributed data architecture for the best-in-class performance and scalability.
