Gregory Way 2018
Here, we use Singular Vector Canonical Correlation Analysis (SVCCA) to assess model stability. We apply SVCCA to the weight matrices learned through all compression models.
SVCCA first performs singular value decomposition (SVD) on weight matrices and retains components that explain 98% of the variation in the data. Following SVD, the algorithm performs canonical correlation analysis (CCA) on the SVD components to align matching components and extract correlations between them. SVCCA is used to compare two different representations, but can be applied to representations of different dimensions. We use SVCCA to extract a single value representing how similar two representations are to each other. This value is the mean of the SVCCA correlation estimates across all dimensions compared.
We analyze the stability of models within z dimensions both within and between algorithms. We also analyze the stability of models across z dimensions within each algorithm independently.
The scripts for applying SVCCA was retrieved from https://github.com/google/svcca. The citation for the method is:
Maithra Raghu, Justin Gilmer, Jason Yosinski, Jascha Sohl-Dickstein (2017). "SVCCA: Singular Vector Canonical Correlation Analysis for Deep Learning Dynamics and Interpretability". Neural Information Processing Systems (NIPS) 2017.
To reproduce the results of the stability analysis perform the following:
# Activate computational environment
conda activate biobombe

# Perform the analysis
# (ensure that `2.ensemble-z-analysis/analysis.sh` is complete)
cd 5.analyze-stability
./stability_analysis.shWe applied SVCCA to all weight matrices across all models derived from our five compression algorithms. The results are compared within each bottleneck dimensions for each dataset independently.
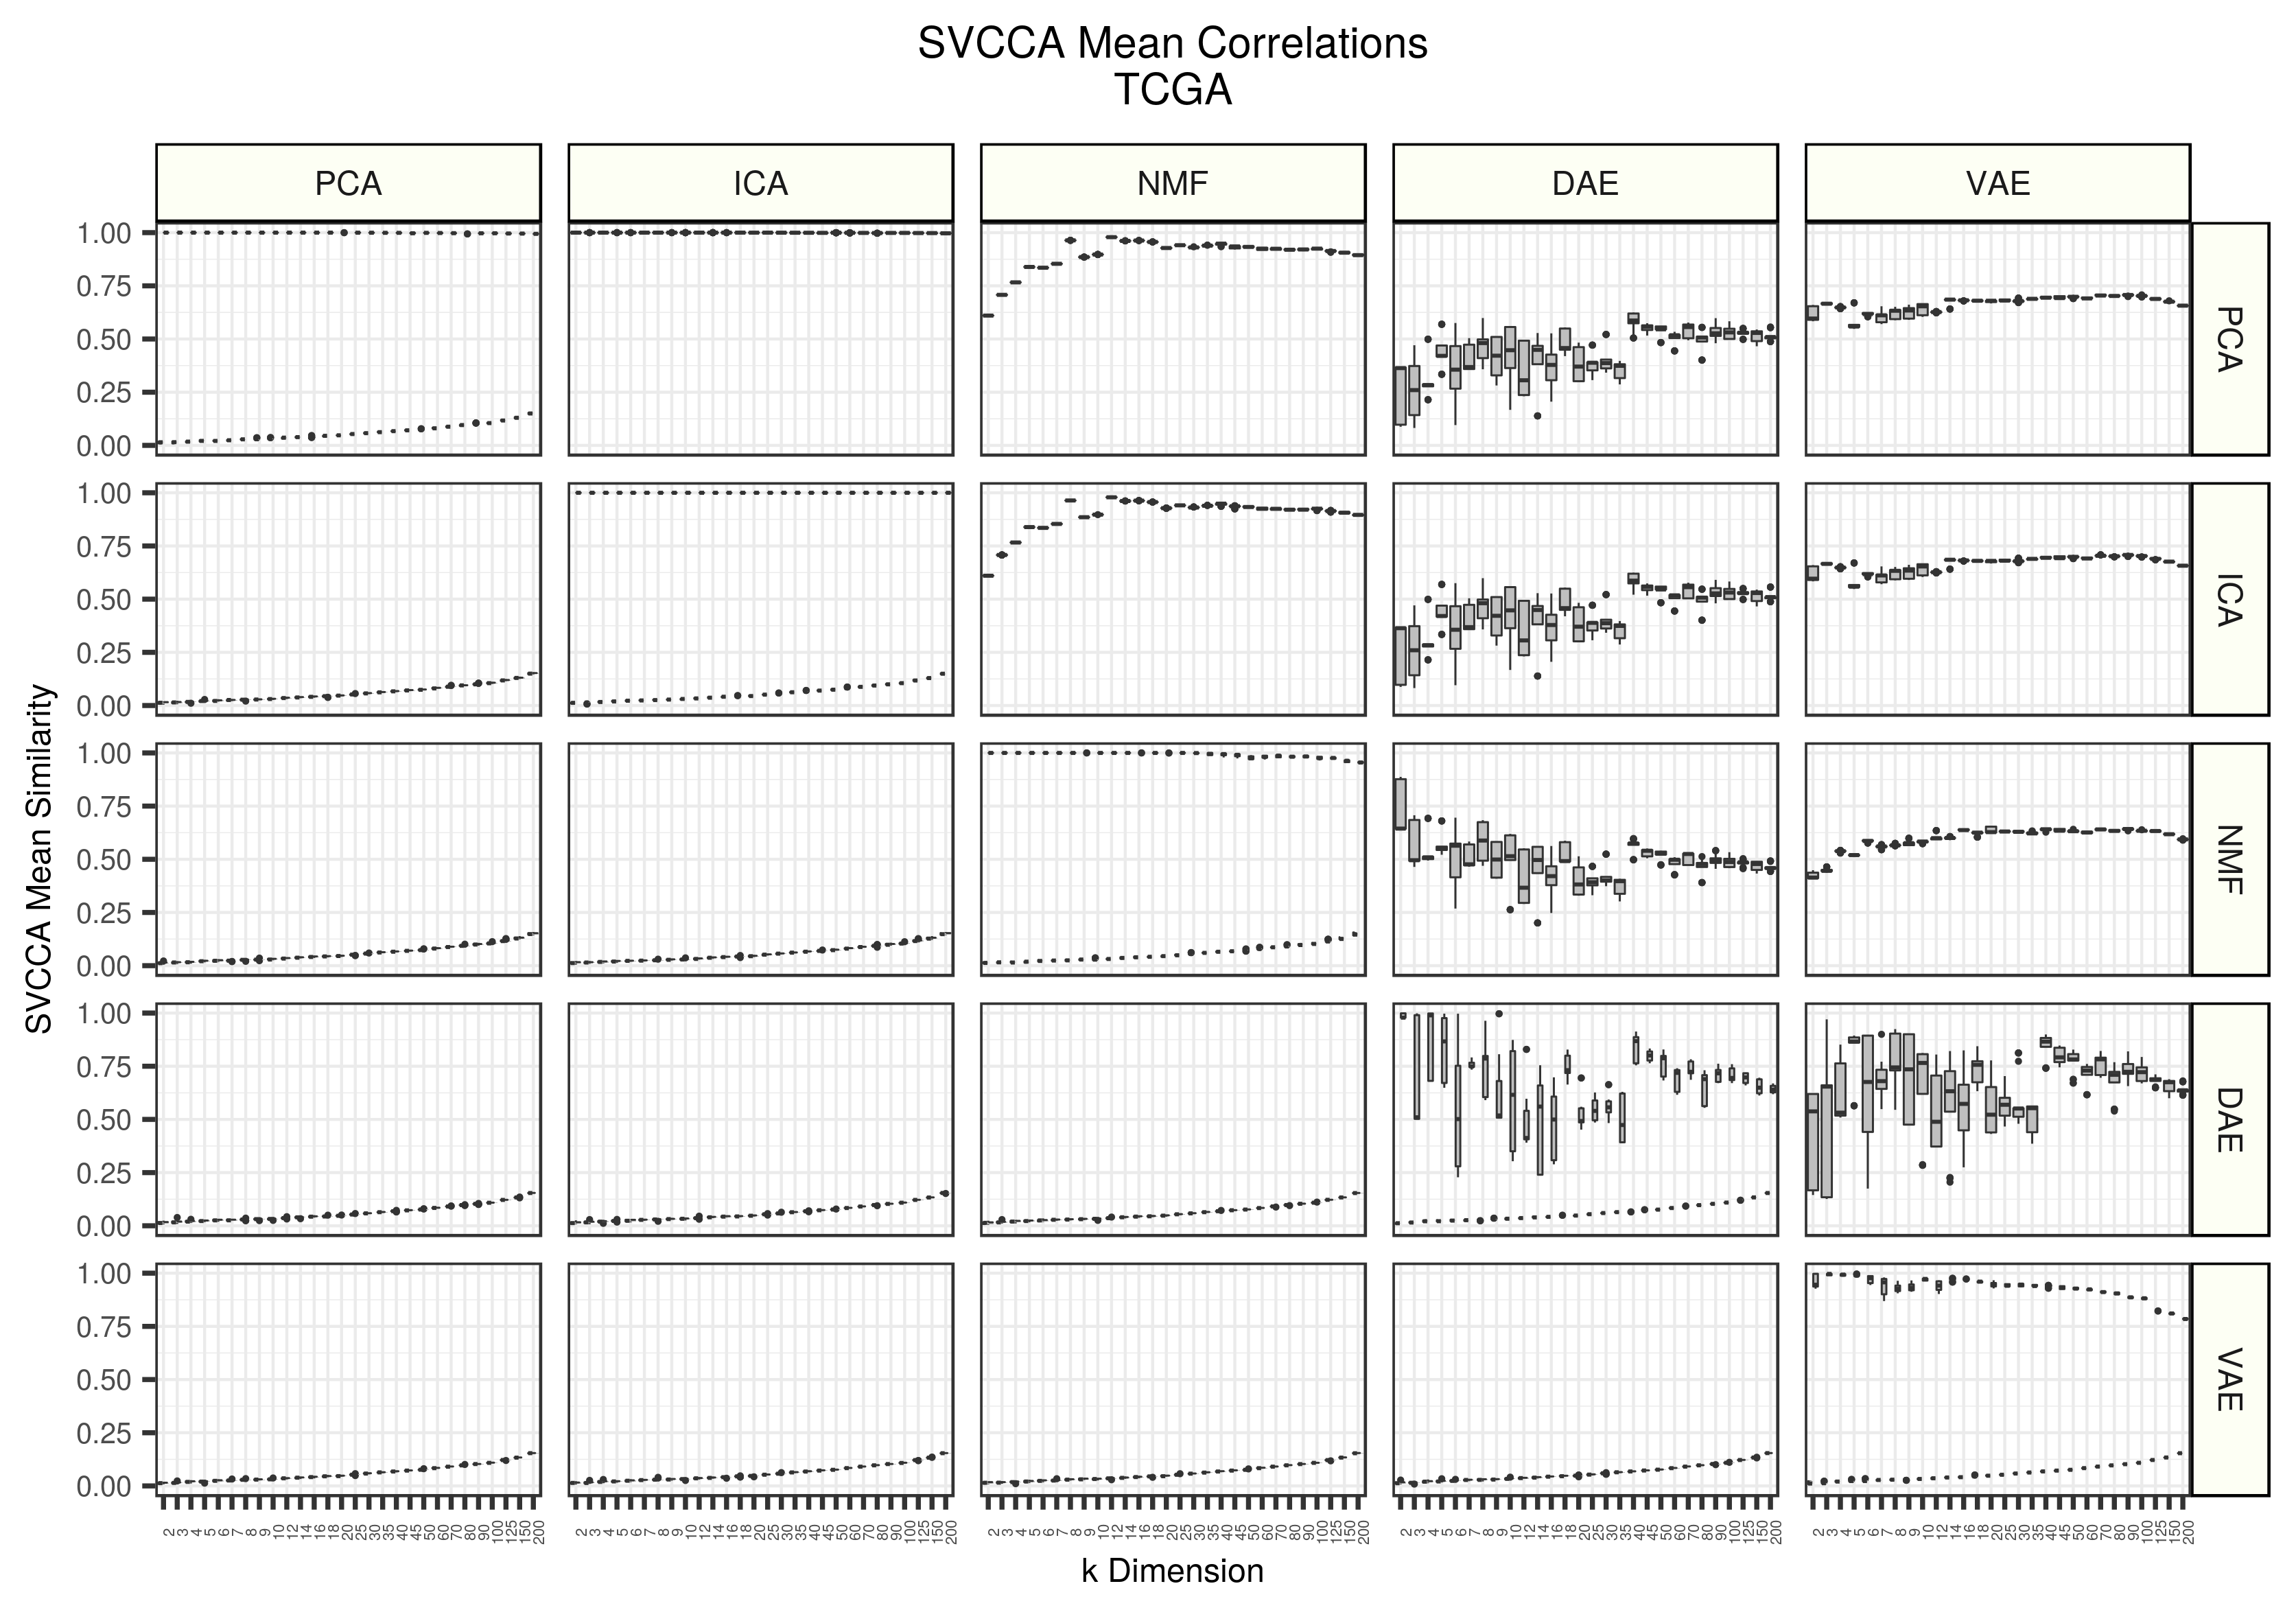
Figure 1 - Assessing the similarity of latent representations in TCGA between algorithms using SVCCA. Each boxplot represents 20 distinct points. All models were trained 5 different times with different random seeds and all seed weight matrices are compared against each other. The top triangle represents real data and the lower triangle represents data trained on randomly permuted input data.
Overall, the neural network models (DAE and VAE) are more variable than the linear methods (PCA, ICA, and NMF). The DAEs are particularly unstable both within iterations and across algorithms. PCA and ICA found nearly identical solutions. VAEs were similar to PCA and ICA in the lower dimensions, but then reduced in similarity. NMFs, however, were not similar to PCA and ICA in early dimensions, but increased in similarity with increasing dimension. The weight matrices learned using shuffled data were not similar. We do observe a consistent and slight increase of similarity in higher dimensions, but this is likely a result of chance correlations.
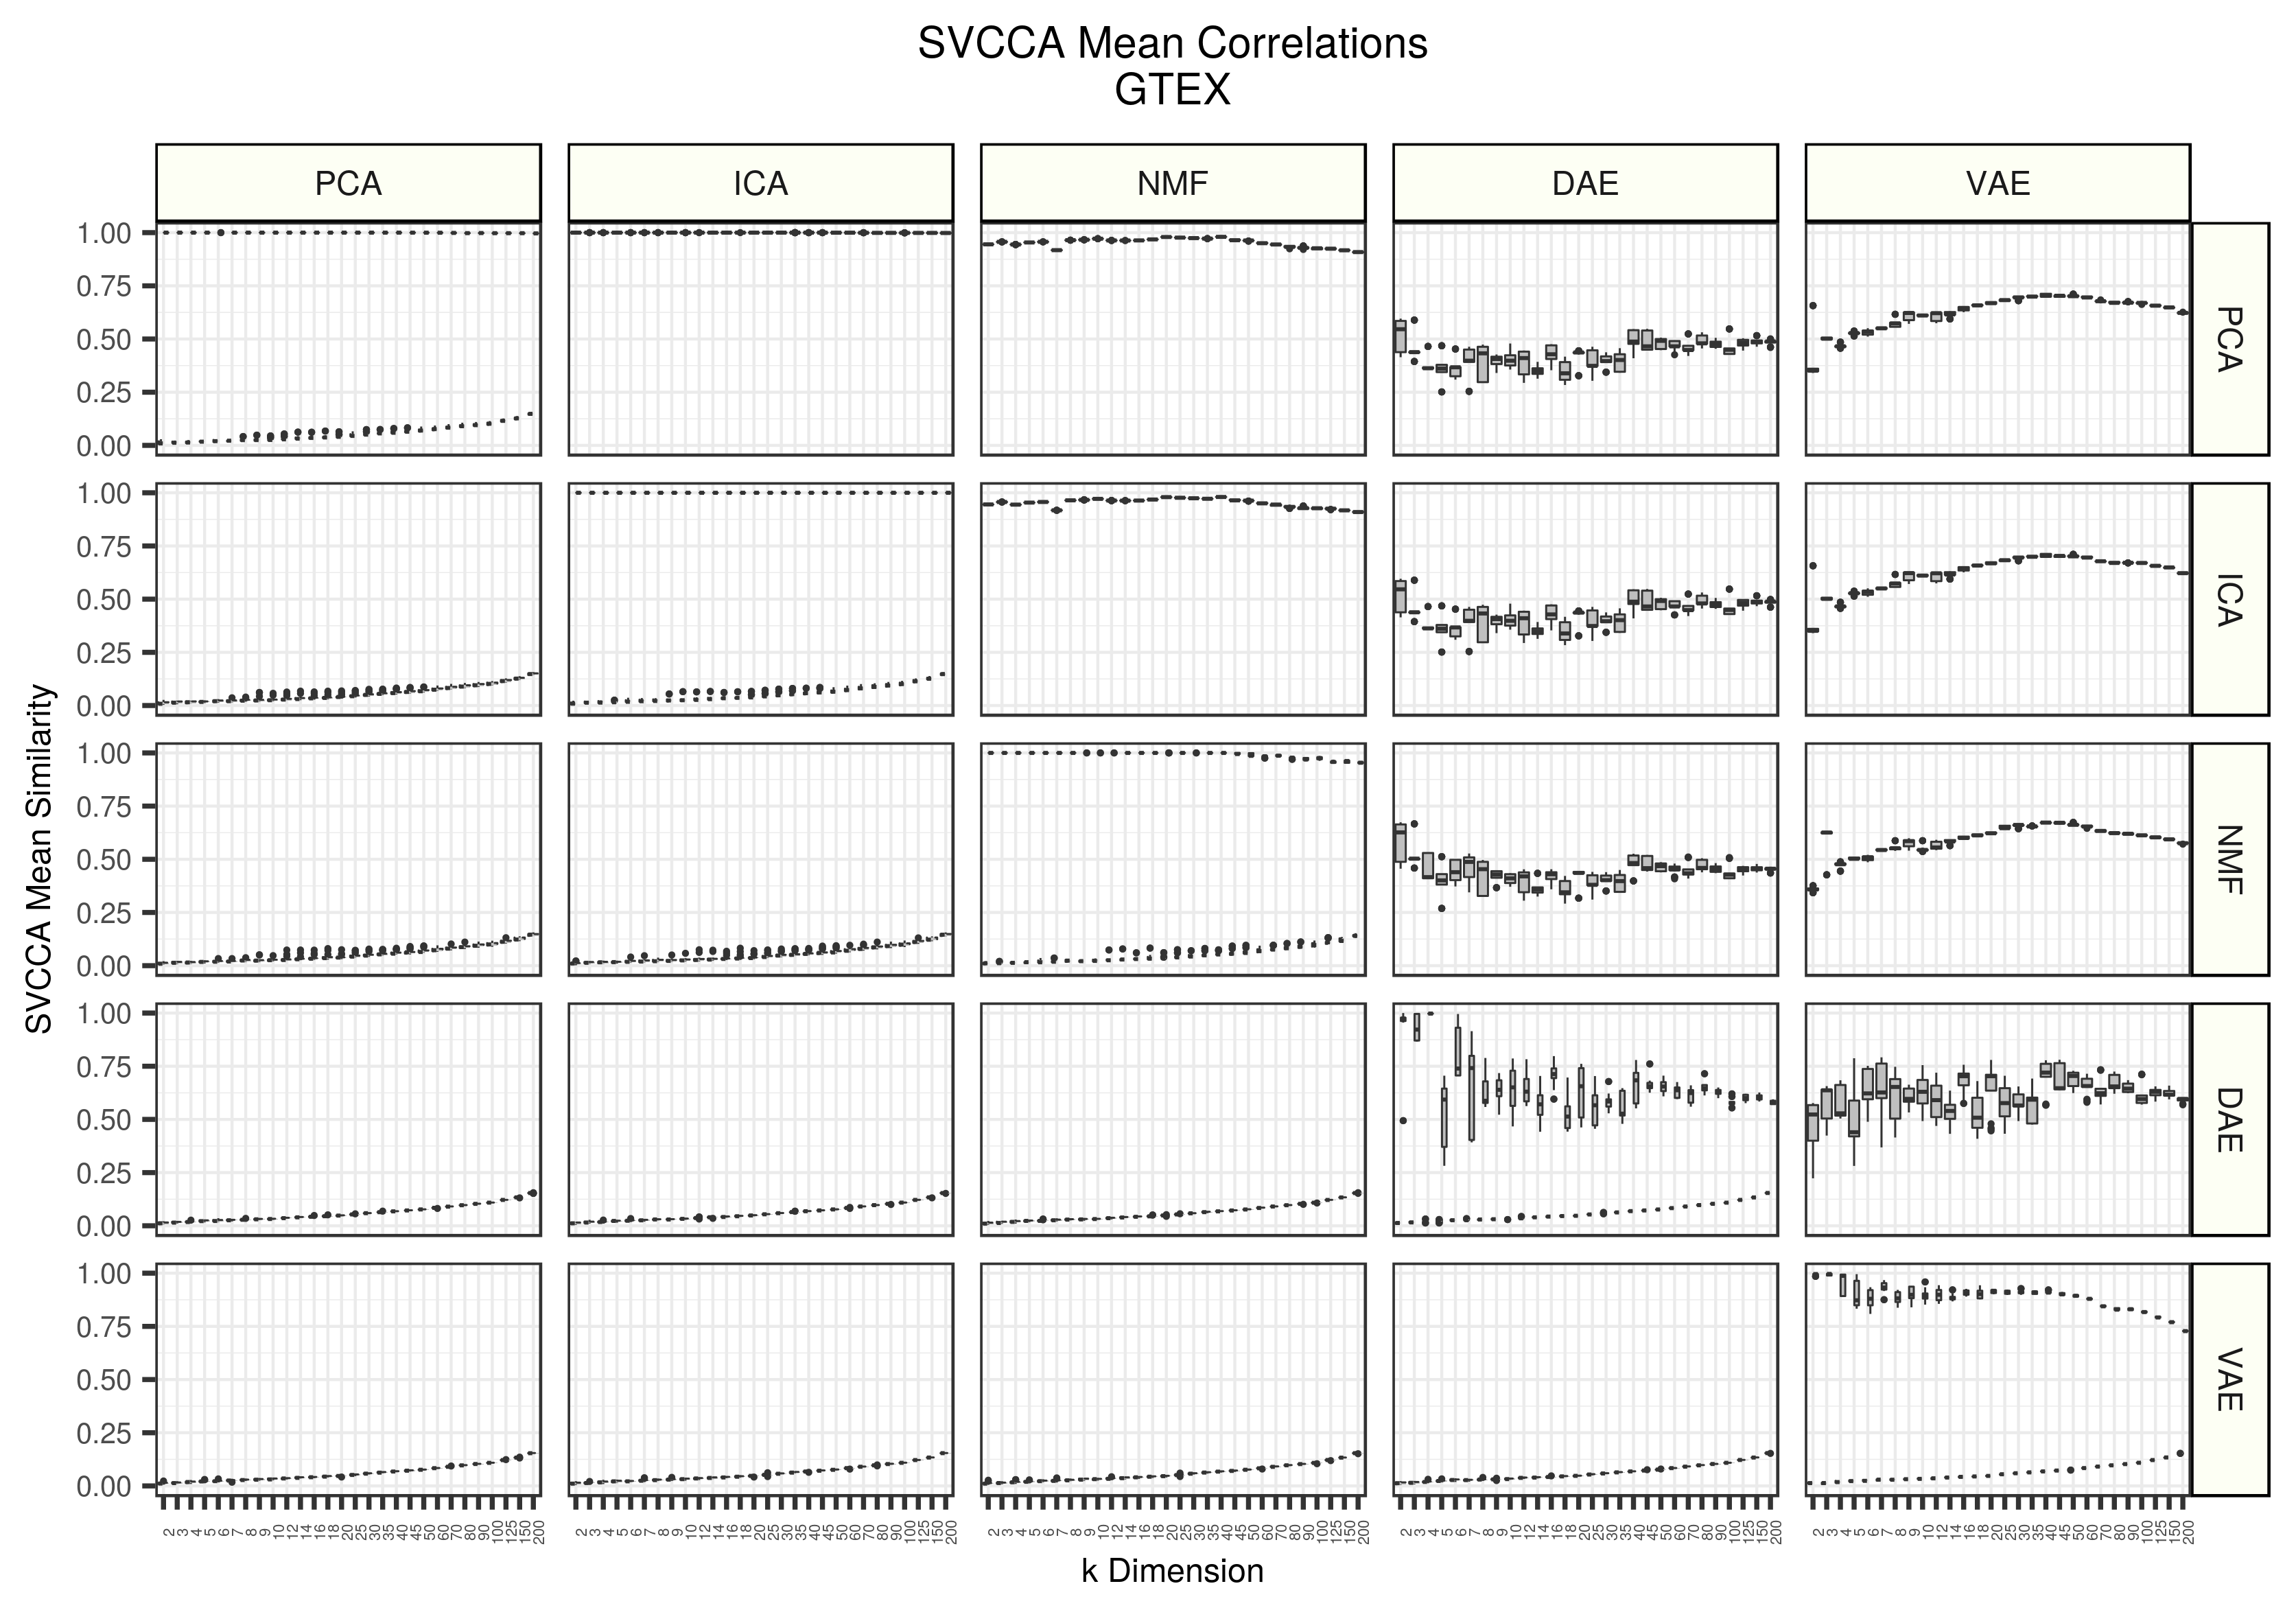
Figure 2 - Assessing the similarity of latent representations in GTEX between algorithms using SVCCA. Each boxplot represents 20 distinct points. All models were trained 5 different times with different random seeds and all seed weight matrices are compared against each other. The top triangle represents real data and the lower triangle represents data trained on randomly permuted input data.
We observe very similar patterns in GTEX as we do in TCGA.
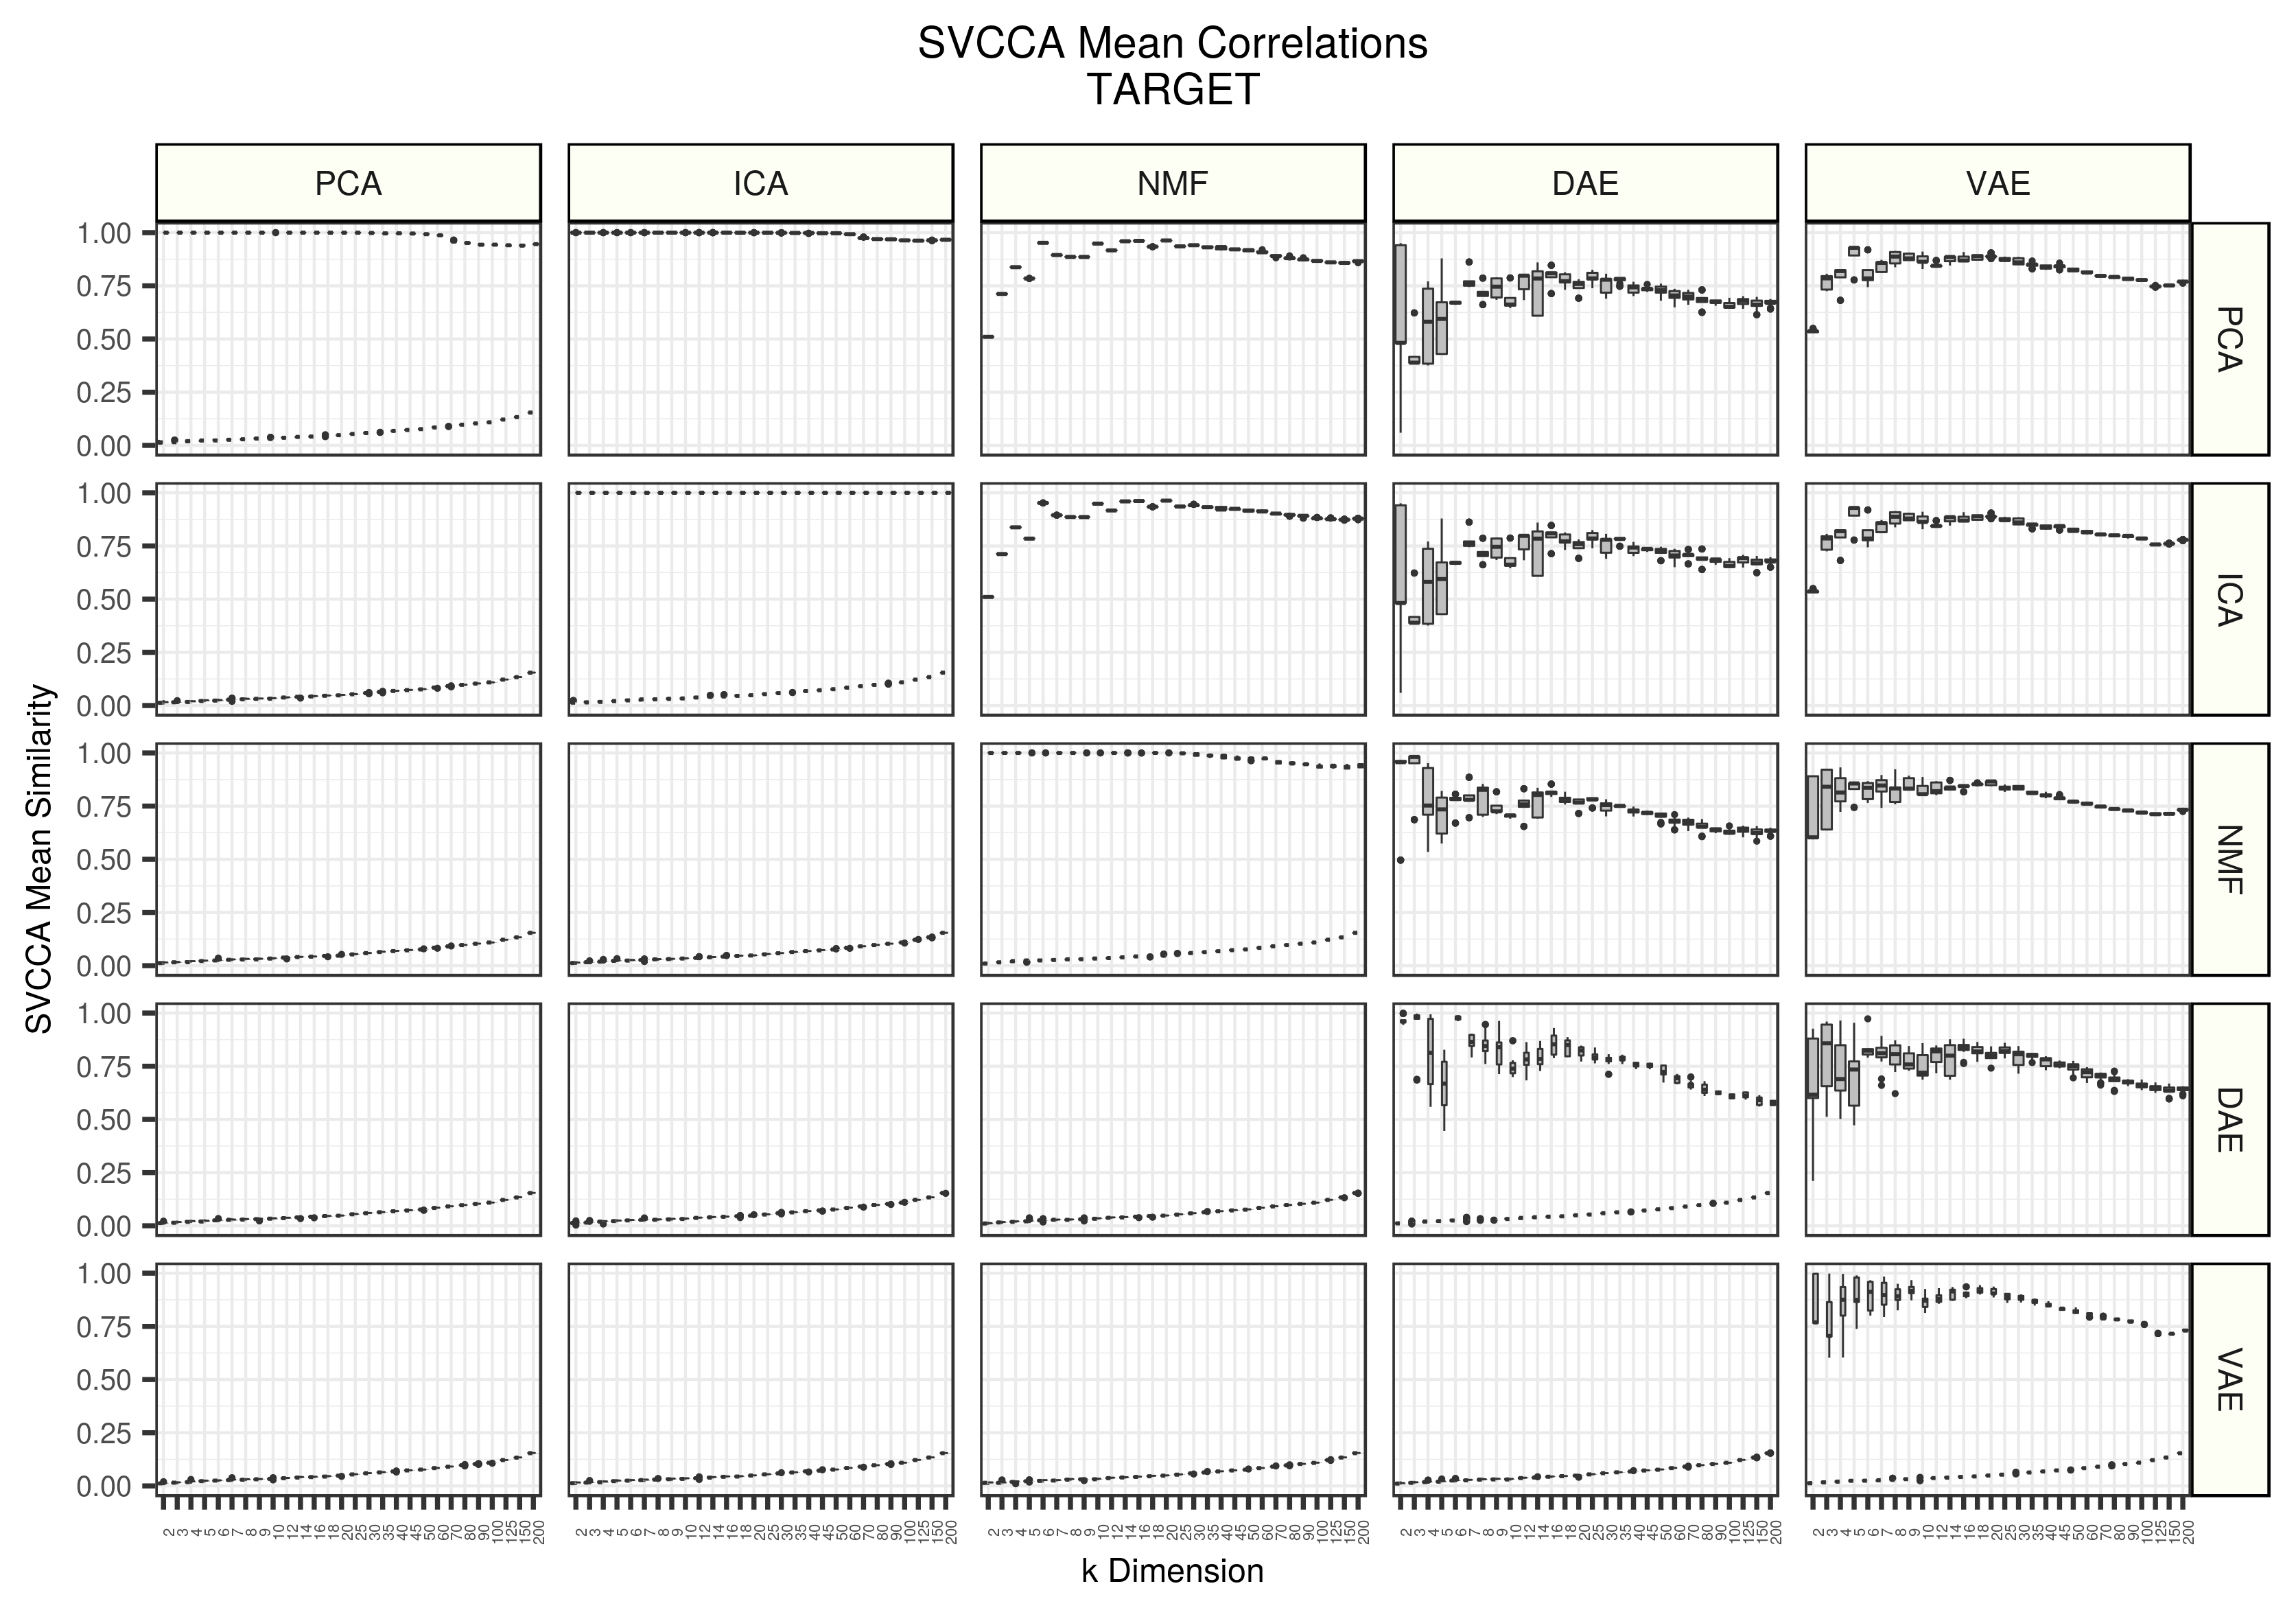
Figure 3 - Assessing the similarity of latent representations in TARGET between algorithms using SVCCA. Each boxplot represents 20 distinct points. All models were trained 5 different times with different random seeds and all seed weight matrices are compared against each other. The top triangle represents real data and the lower triangle represents data trained on randomly permuted input data.
Patterns are also similar in TARGET as we observe in TCGA and GTEX. PCA does drop in similarity in high dimensions, but this is likely because of convergence issues, small sample sizes, or an effect of the SVCCA algorithm itself. DAE also increased in stability and appear closer to VAE estimated stability. All other algorithms remained relatively consistent, even when compressing a small dataset.
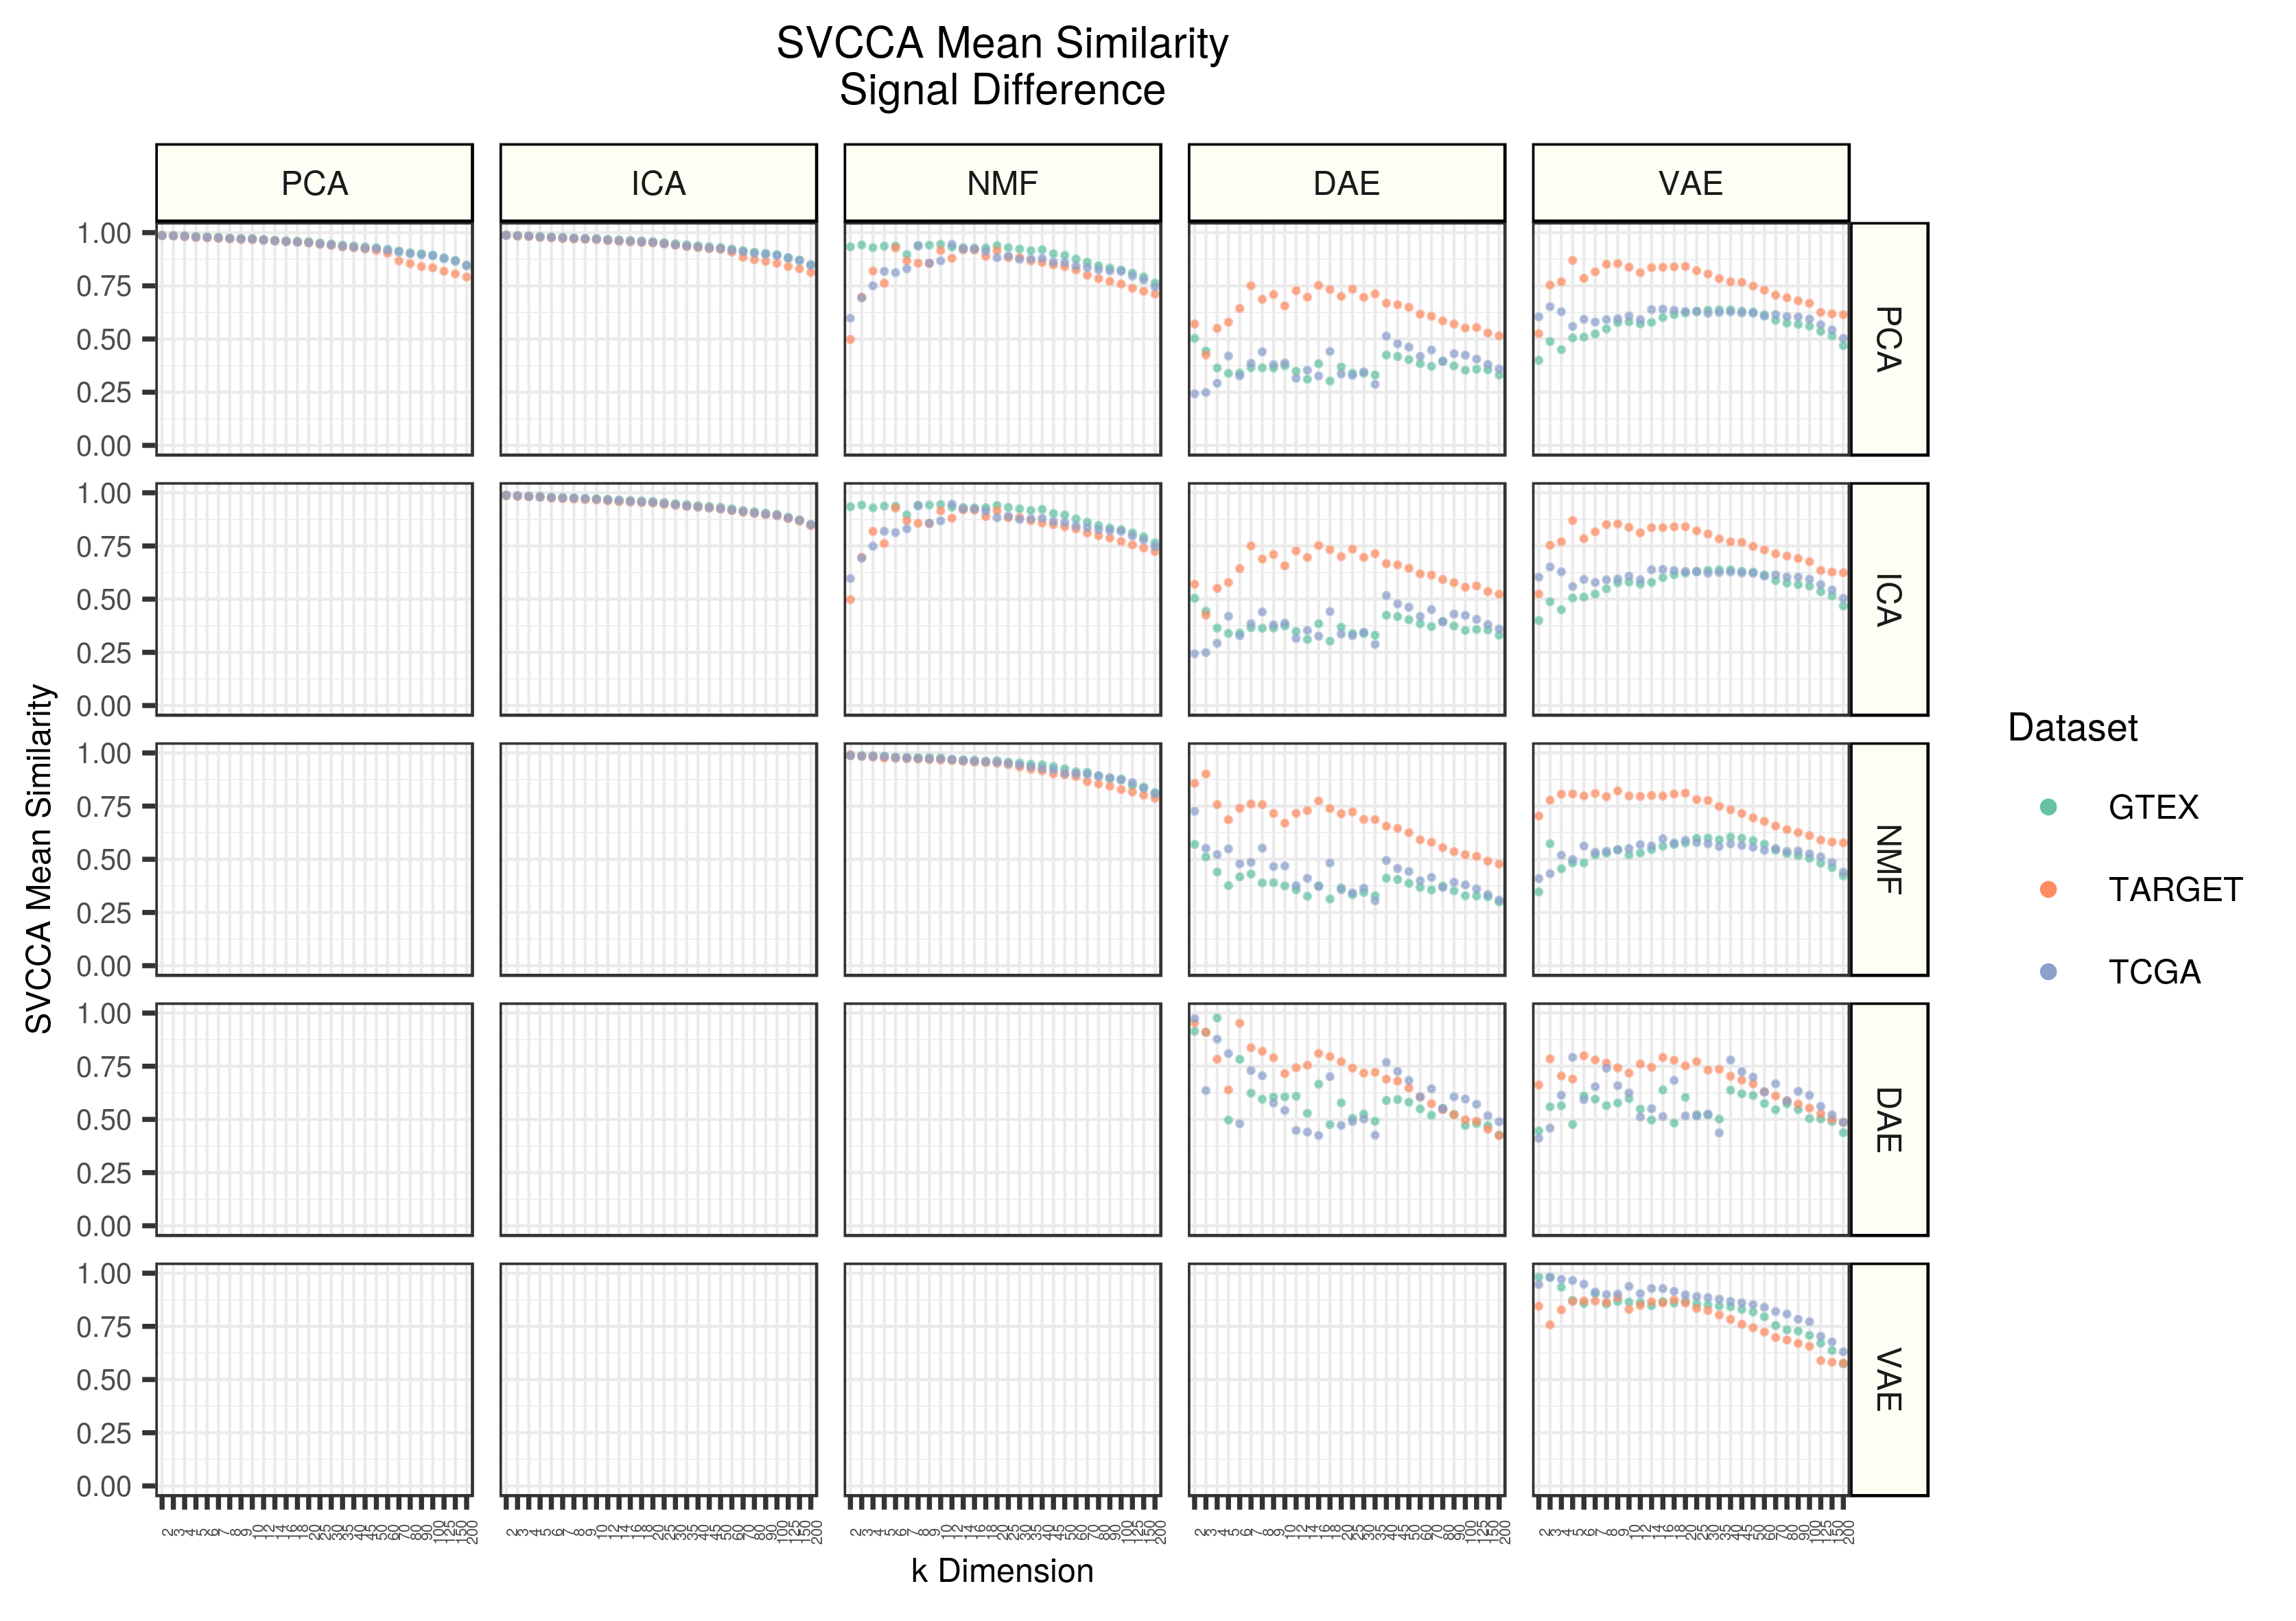
Figure 4 - Mean stability estimates across datasets and z dimensions for each dataset. The value shown for each point represents the mean SVCCA similarity with real data subtracted from the mean SVCCA similarity of permuted data.
A useful feature of SVCCA is the ability to compare representations of different dimensions. Here, we compared different compressed representations of gene expression data across different bottleneck dimensions. These comparisons were done within each algorithm and within each dataset, independently.
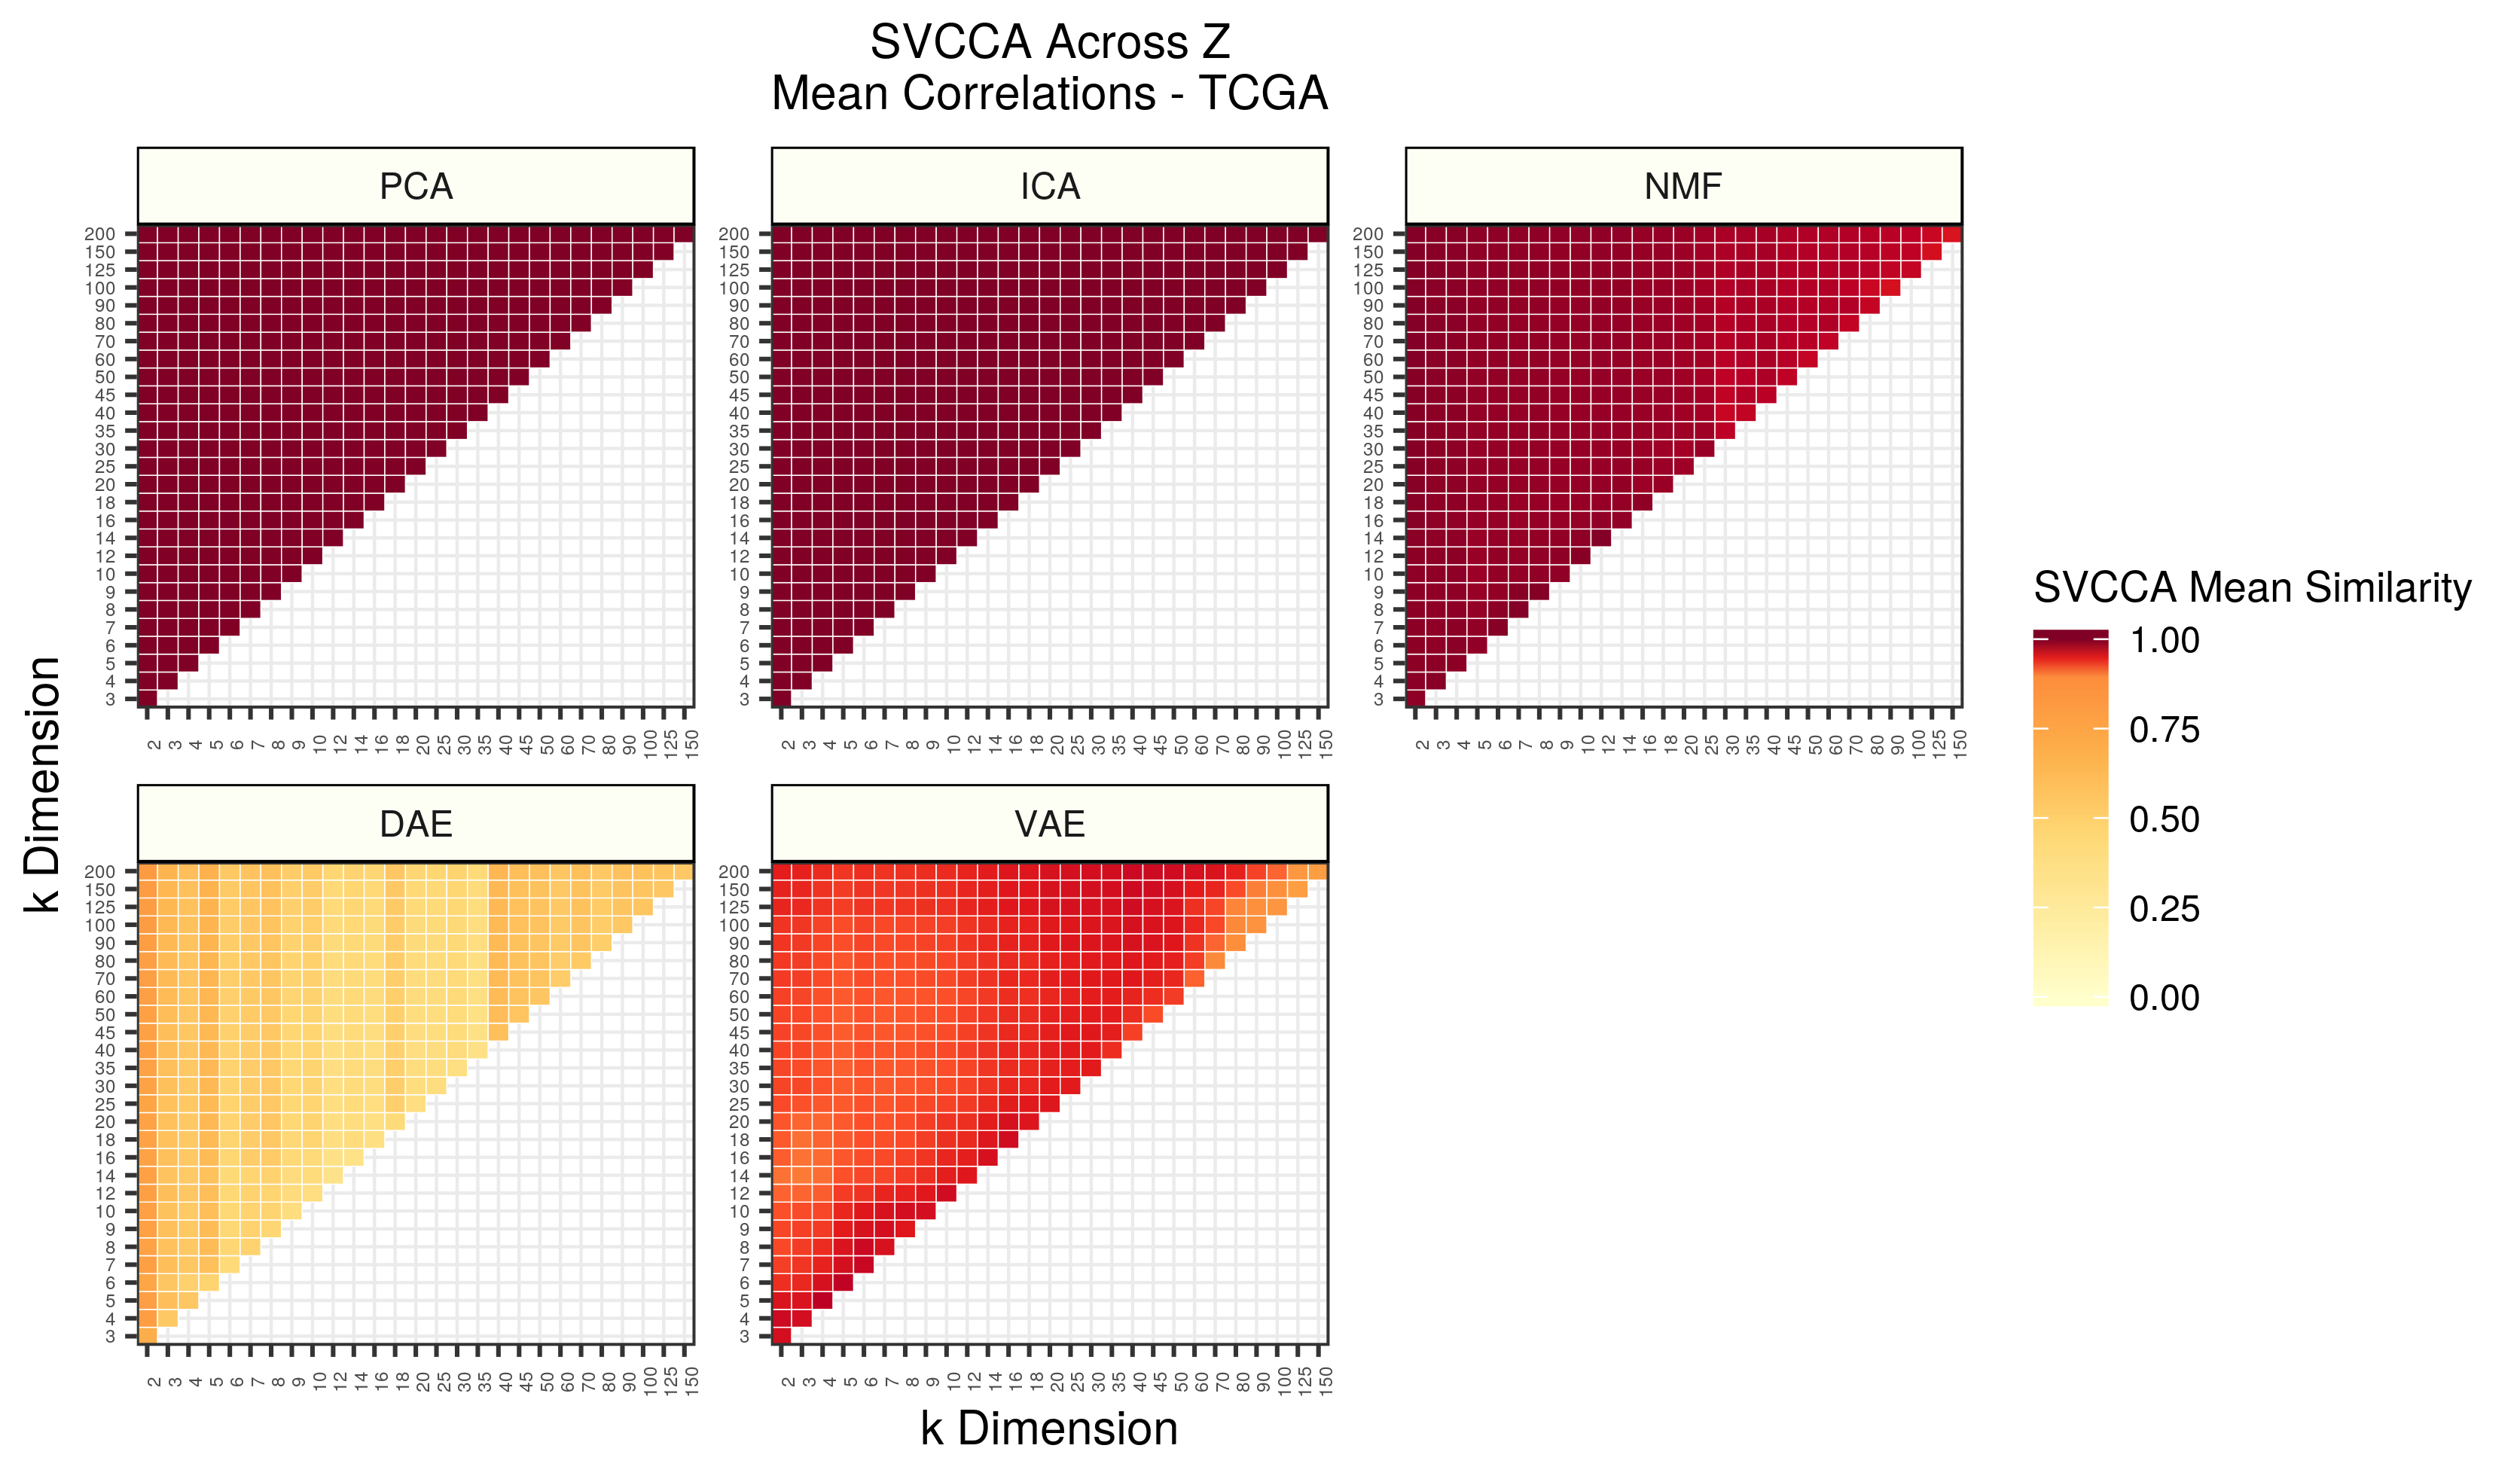
Figure 5 - Assessing the similarity of latent representations in TCGA across different z dimensions within each algorithm using SVCCA. Each square in the heatmap represents the mean SVCCA similarity metric for canonical correlation estimates identified in the smallest dimension. The squares are averages of 25 comparisons (5 iterations of both input z dimensions).
As dimensions were increased in PCA and ICA, nearly identical representations were learned. As the dimensionality was increased in NMF, slightly different, but still highly similar, representations were learned. DAE had relatively low mean canonical correlations across dimensions. Interestingly, VAEs had different regions of high and low similarity. The strongest correlations were found while increasing the bottleneck by a few dimensions, but there were also pockets of high similarity when comparing relatively low and relatively high dimensions. Comparing high dimensions to one another resulted in the lowest correlation estimates.
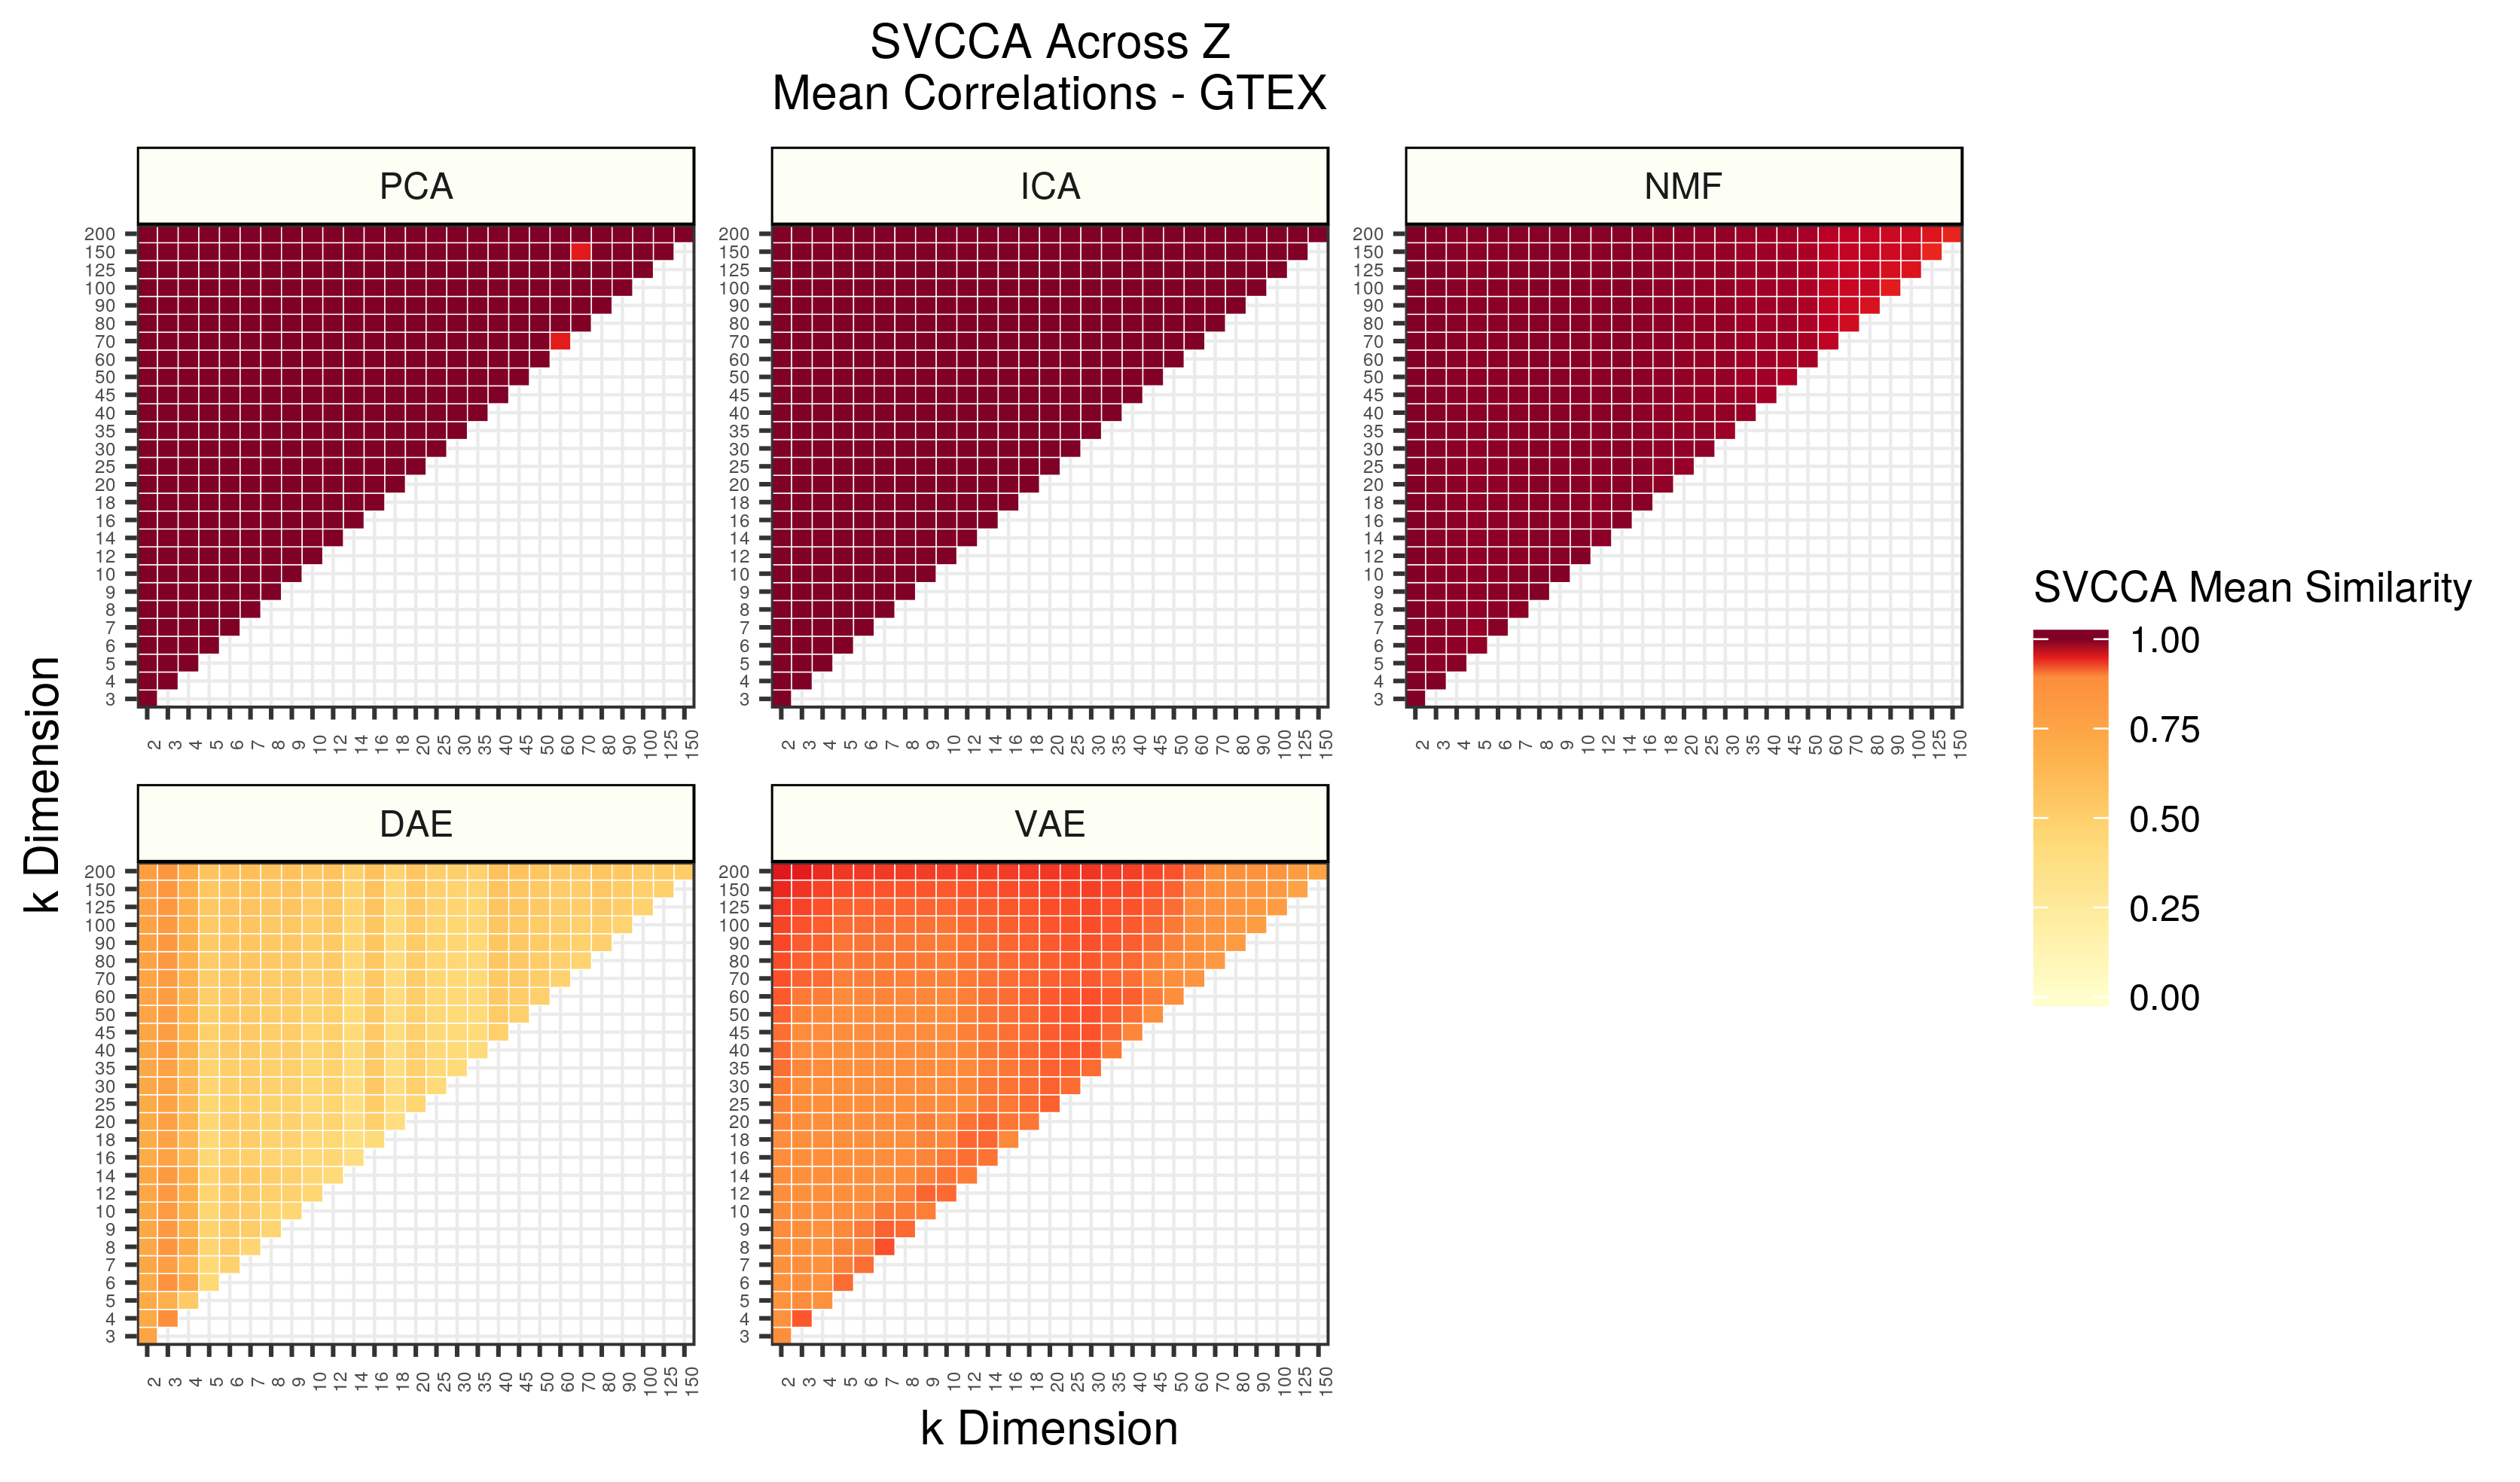
Figure 6 - Assessing the similarity of latent representations in GTEX across different z dimensions within each algorithm using SVCCA. Each square in the heatmap represents the mean SVCCA similarity metric for canonical correlation estimates identified in the smallest dimension. The squares are averages of 25 comparisons (5 iterations of both input z dimensions).
The GTEX observations are nearly identical, and perhaps even more exaggerated, than the TCGA results.
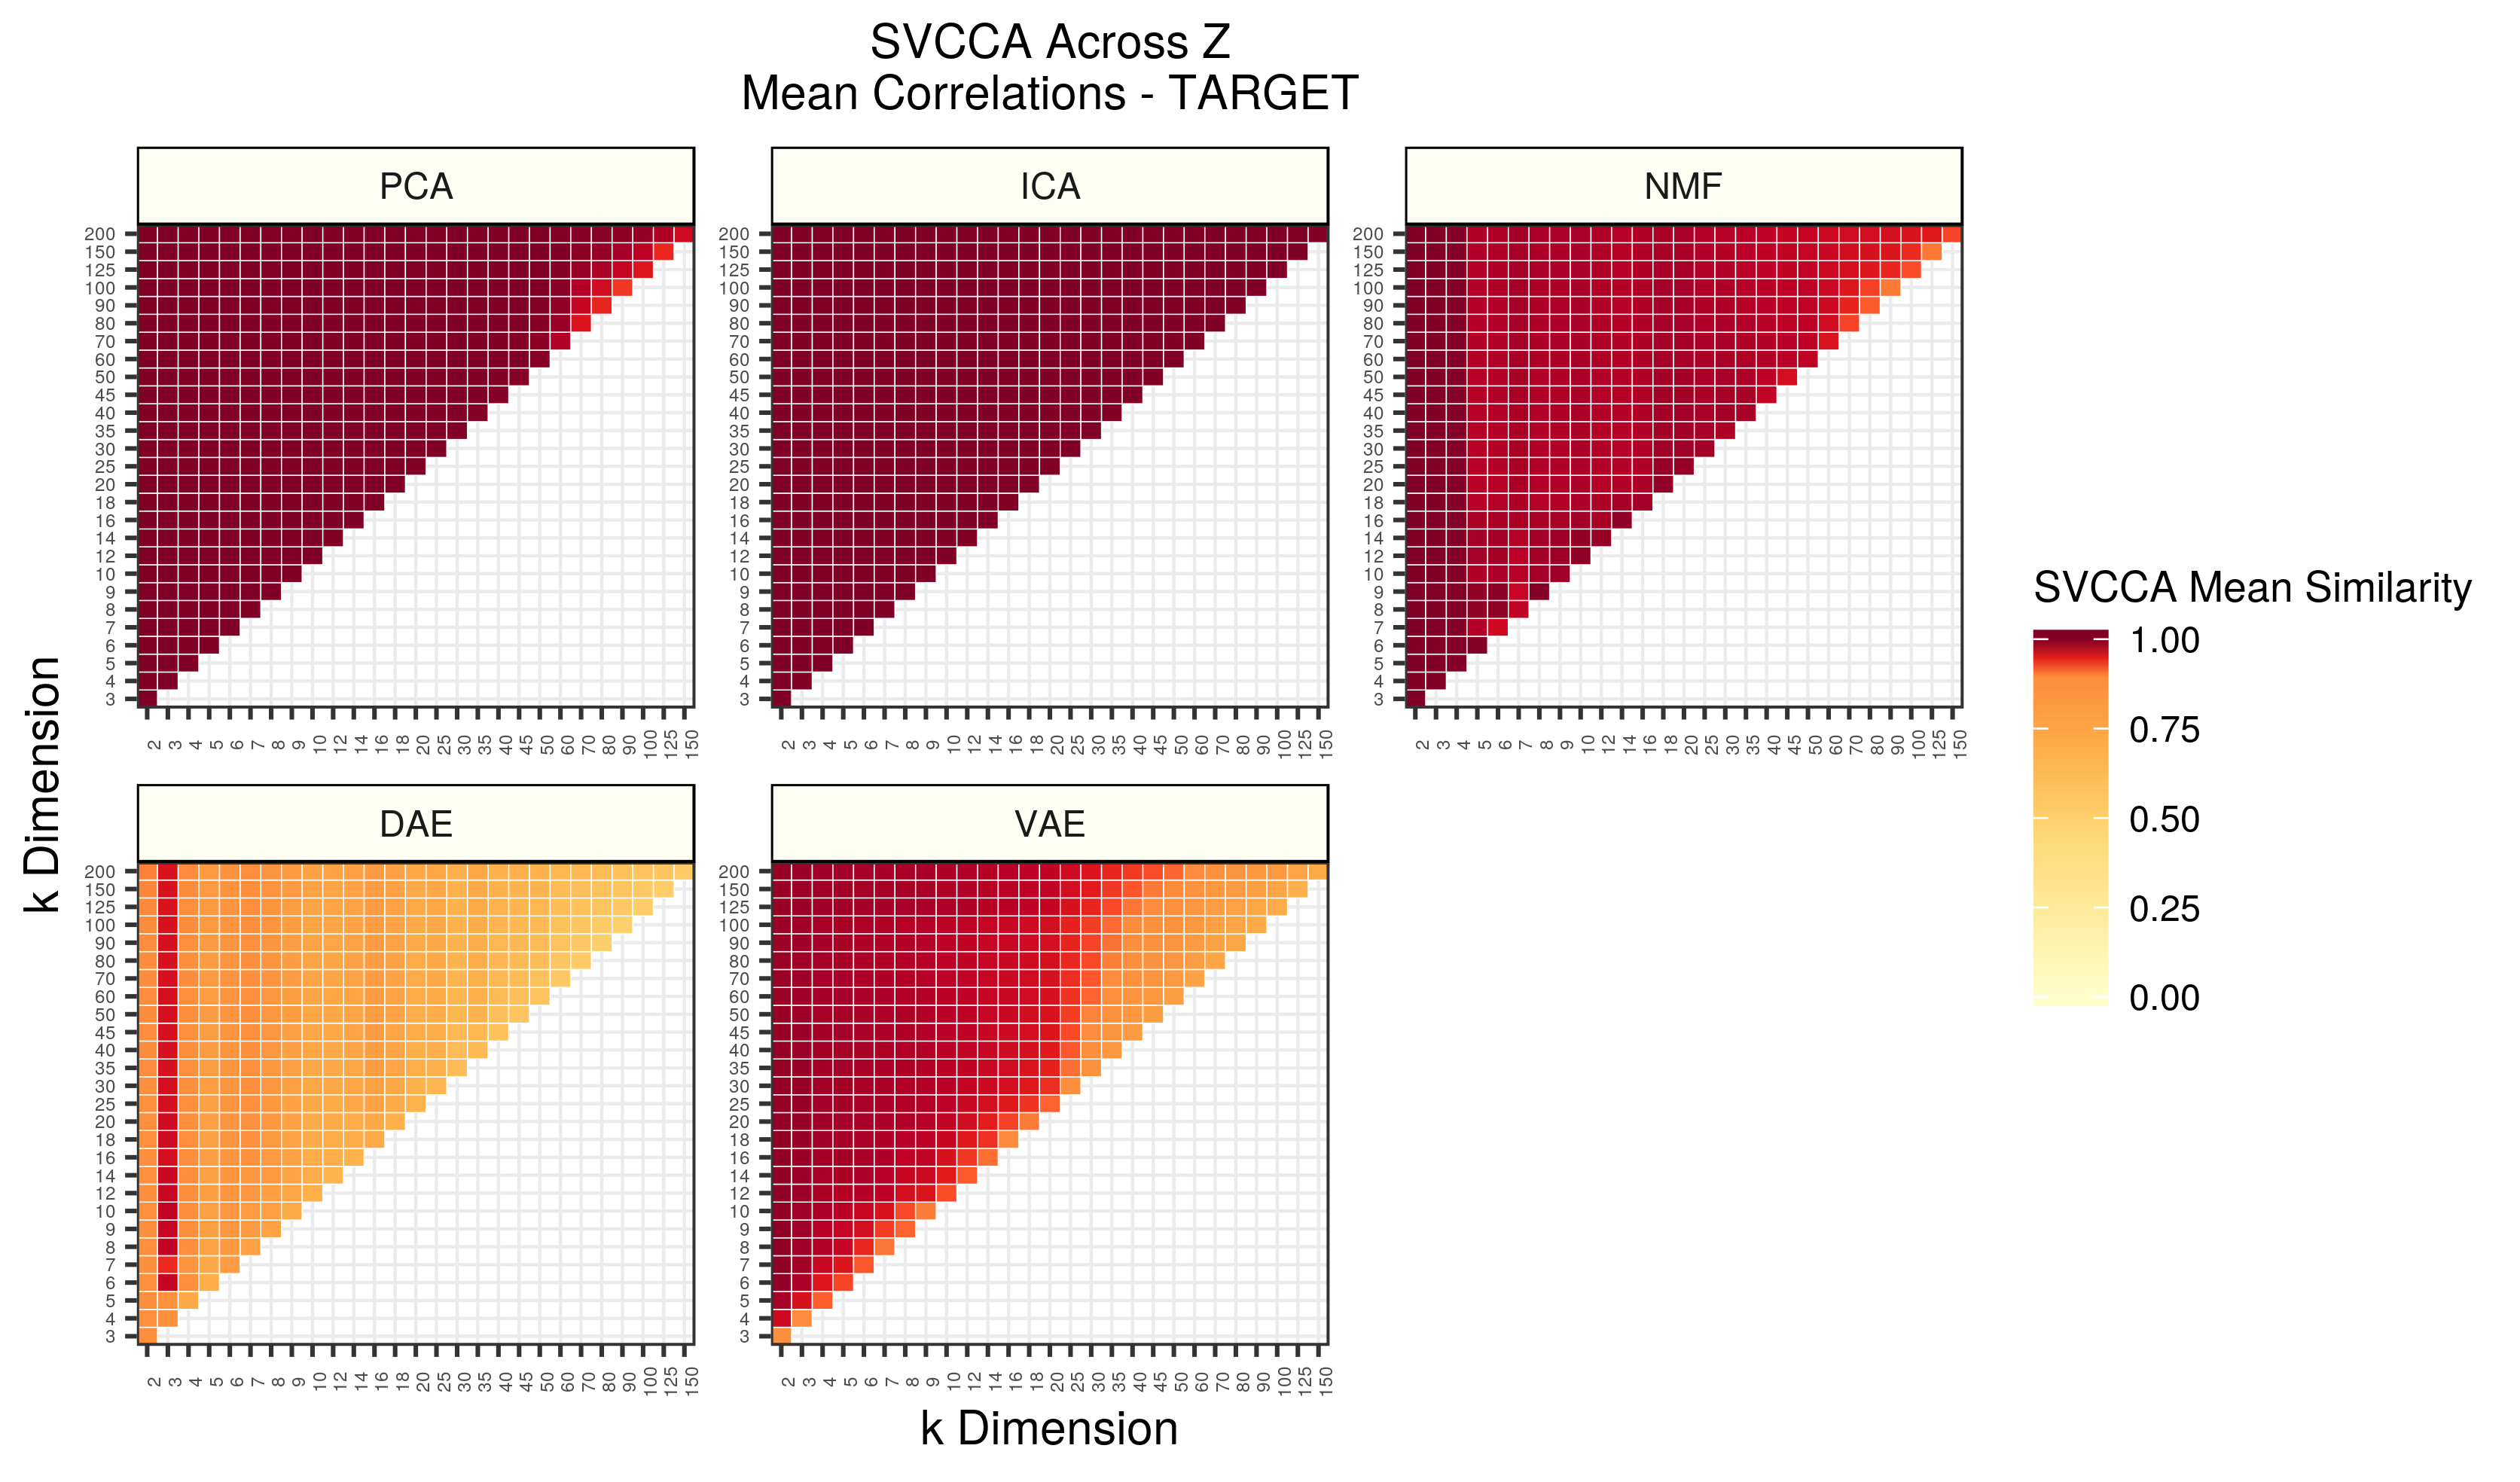
Figure 7 - Assessing the similarity of latent representations in TARGET across different z dimensions within each algorithm using SVCCA. Each square in the heatmap represents the mean SVCCA similarity metric for canonical correlation estimates identified in the smallest dimension. The squares are averages of 25 comparisons (5 iterations of both input z dimensions).
ICA was the most stable algorithm in the TARGET data. PCA was also stable, except for high dimensions. This is likely a result of low sample sizes and/or artificial biases in the SVCCA implementation. NMF had lower similarity as well. The neural network models were remarkably stable given the low sample sizes present. The same signals found in low dimensions seemed to perpetuate in both, but to a large extent with VAEs. The stability decreased as the dimensionality increased.