Multi session
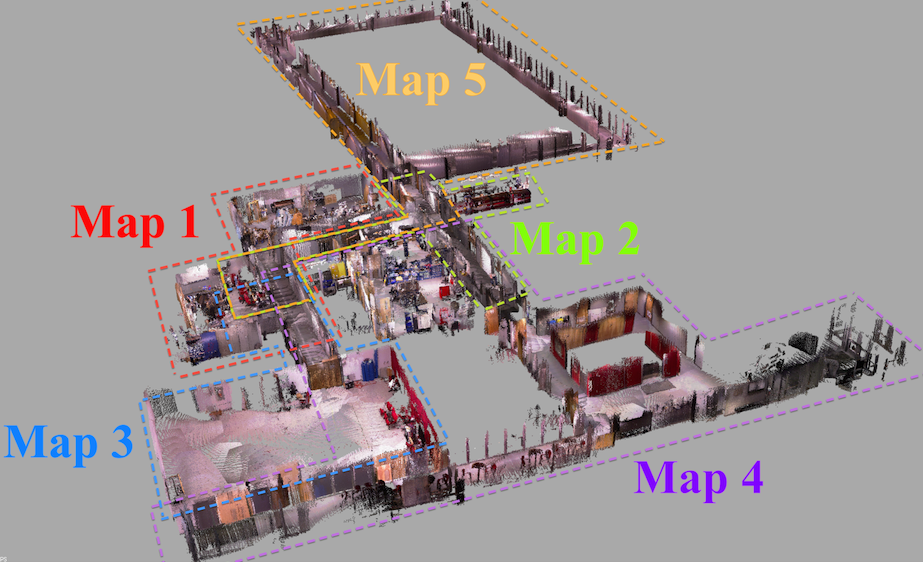
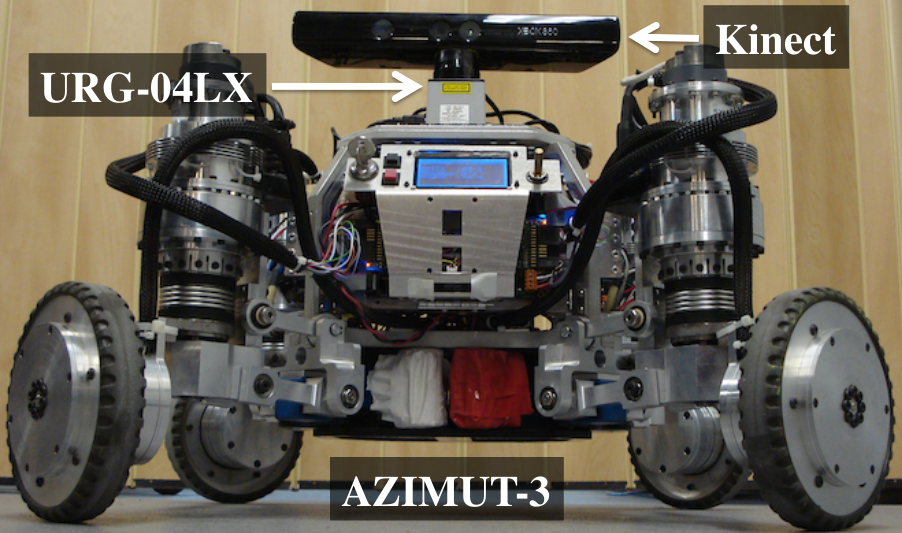
We will process consecutively five input databases that contain data taken from a robot during five mapping sessions. Databases at 1 Hz (smaller size) and 10 Hz (high feedback) are provided of the same experiments with the respective RTAB-Map settings files. The databases were created from the ROS bags on ROS page by using data_recorder node.
Updated 2015/09/21: Synchronized laser scans and images with odometry.
- map1_1Hz.db.zip
- map2_1Hz.db.zip
- map3_1Hz.db.zip
- map4_1Hz.db.zip
- map5_1Hz.db.zip
- multi-session1Hz.ini
- map1_10Hz.db.zip
- map2_10Hz.db.zip
- map3_10Hz.db.zip
- map4_10Hz.db.zip
- map5_10Hz.db.zip
- multi-session10Hz.ini
For these experiments, some parameters are modified from the default ones. To simplify, a settings file is provided with the map data above. Open RTAB-Map, then go in Window -> Preferences -> General settings (GUI). Click on "Load settings (*.ini)" and select the settings file downloaded (multi-session1Hz.ini or multi-session10Hz.ini).
There are two differences between the two ini files:
- 1 Hz, ensure processing all images
- Rtabmap/DetectionRate=0
- Rtabmap/ImageBufferSize=0
- 10 Hz, only process 1 of 10 images (detection rate still at 1 Hz)
- Rtabmap/DetectionRate=1
- Rtabmap/ImageBufferSize=1
While in the Preferences dialog, select "Source" on the left. Scroll down, check "Database source" and select the first database downloaded (map1_1Hz.db or map1_10Hz.db). Odometry was saved in databases so leave uncheck "Ignore odometry". Now scroll up to "Input rate". Set 1 Hz if you downloaded the 1 Hz databases or 10 Hz if you downloaded the 10 Hz databases. Press "Ok" to close the dialog.

- Do File -> "New Database".
- For visualization, it is recommended to show the "3D Map", "Loop closure detection" and "Graph view" panels. To open these panels, select "Window" -> "Show view".
- Press start! (or Edit->Start)
- When the mapping of the first map is done, the process should stop itself. Now process the second map. Select Detection->"Select source"->"Database...", and chose the second database (map2_1Hz.db or map2_10Hz.db). Redo this step after map 2 is finished, then for maps 3, 4 and 5. You should see something like this (note this video is not the actual first database):

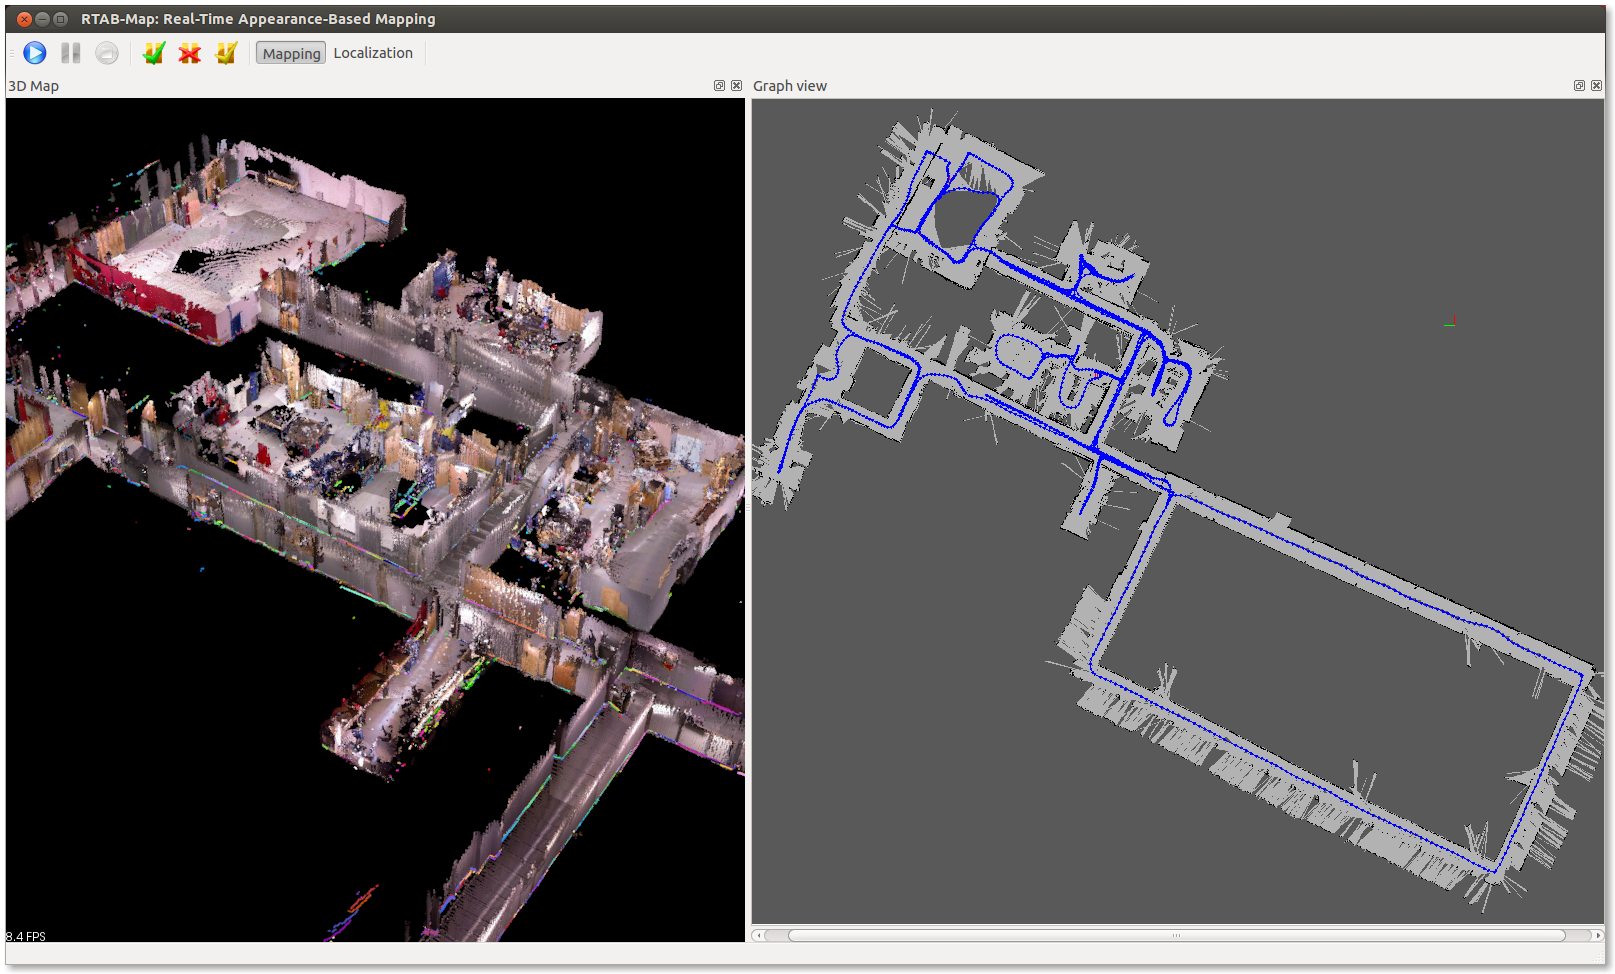
During the online mapping, only the local map and local graph can be visualized. After processing the data or when you do "Pause", you can request that the core generates the global graph for you. To show the global map and the global graph, select Edit->"Download graph only", then in the dialog, select "Global map optimized" (you can try the other options to see what happens).
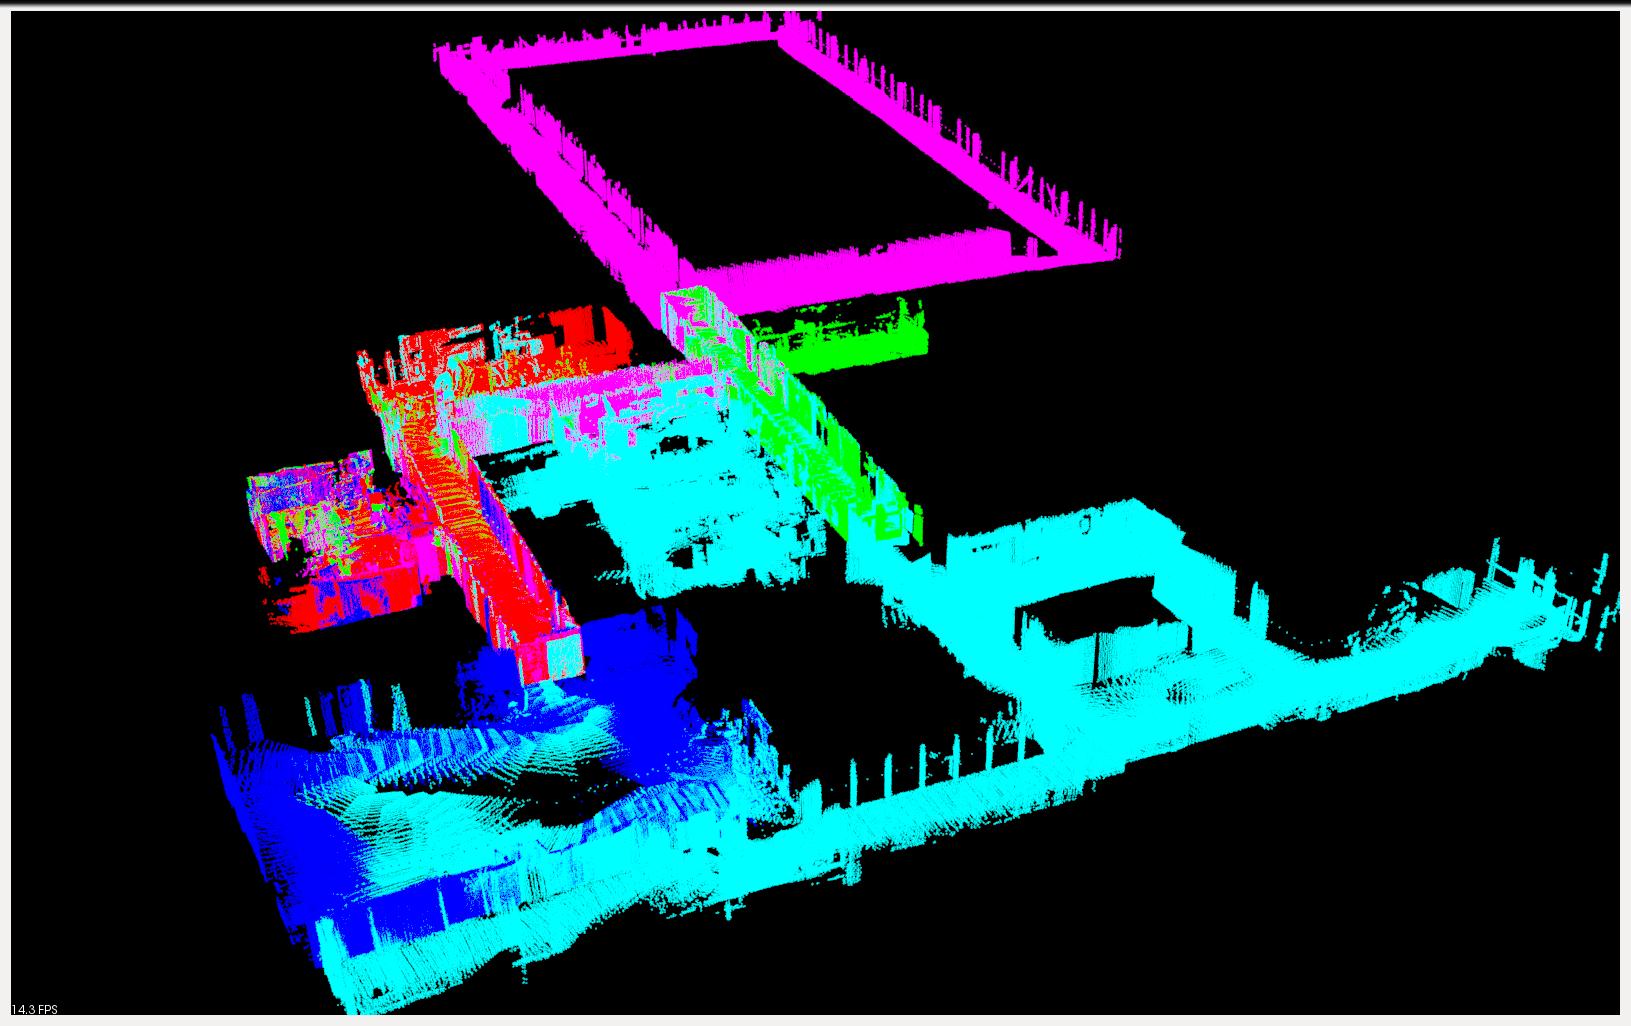
From RTAB-Map 0.7.1, you can press key "2" in the cloud view to show maps segmented with different colors.
If you don't want to process all the data above and just see the results in RTAB-Map, two resulting output databases can be downloaded here:
-
5MappingSessions_OnlineConstraint700ms.db.zip (with online constraint to 700 ms, like in the example above)
-
5MappingSessions_NoOnlineConstraint.db.zip (without online constraint)
-
To load these databases, do File -> "Open database...".
-
Edit -> "Download all clouds (update cache)" and select "Global map optimized", this will download the global map with all point clouds data. You should see in "3D Map" view the map (you may need to scroll with the mouse to zoom out or turn the camera by clicking with the mouse in the view). If you want to see the occupancy grid map and the graph, open Window->"Show view" -> "Graph view". If it was not visible when downloading the map, you should re-download de graph (only the graph without the clouds) by clicking on Edit->"Download graph only".
Here a video comparing the two resulting databases (with and without online constraint):
