We read every piece of feedback, and take your input very seriously.
To see all available qualifiers, see our documentation.
Have a question about this project? Sign up for a free GitHub account to open an issue and contact its maintainers and the community.
By clicking “Sign up for GitHub”, you agree to our terms of service and privacy statement. We’ll occasionally send you account related emails.
Already on GitHub? Sign in to your account
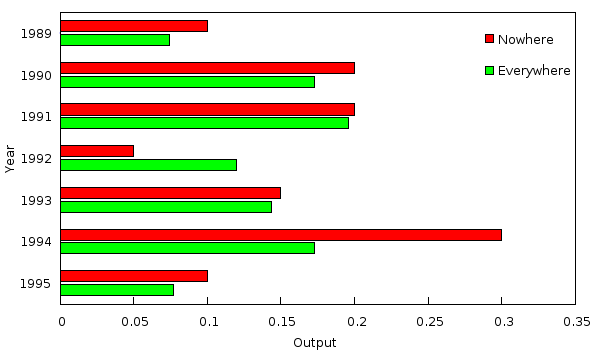
Having a bar diagram would be really nice:
This could be quite useful for blogposts and articles. It can be done with GnuPlot. For instance, here's the description on how to create the diagram above: http://www.phyast.pitt.edu/~zov1/gnuplot/html/histogram.html
The text was updated successfully, but these errors were encountered:
No branches or pull requests
Having a bar diagram would be really nice:
This could be quite useful for blogposts and articles.
It can be done with GnuPlot. For instance, here's the description on how to create the diagram above: http://www.phyast.pitt.edu/~zov1/gnuplot/html/histogram.html
The text was updated successfully, but these errors were encountered: