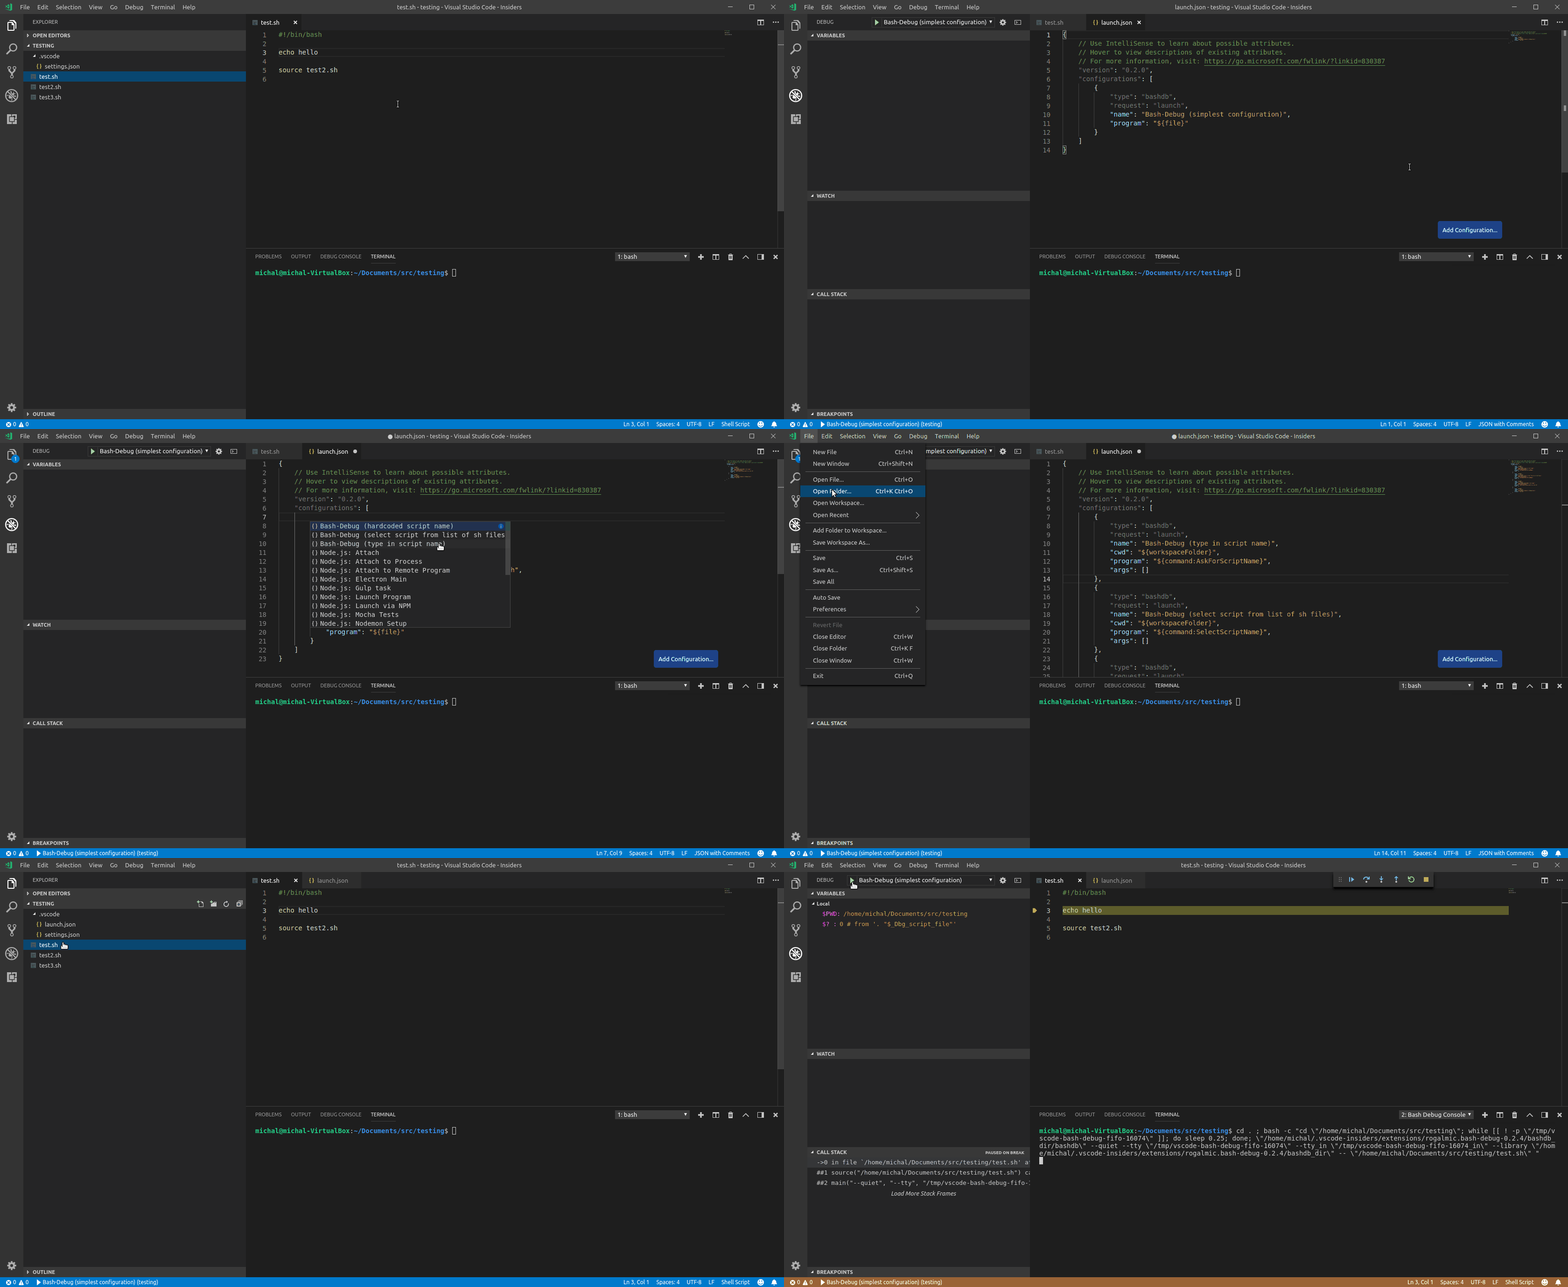
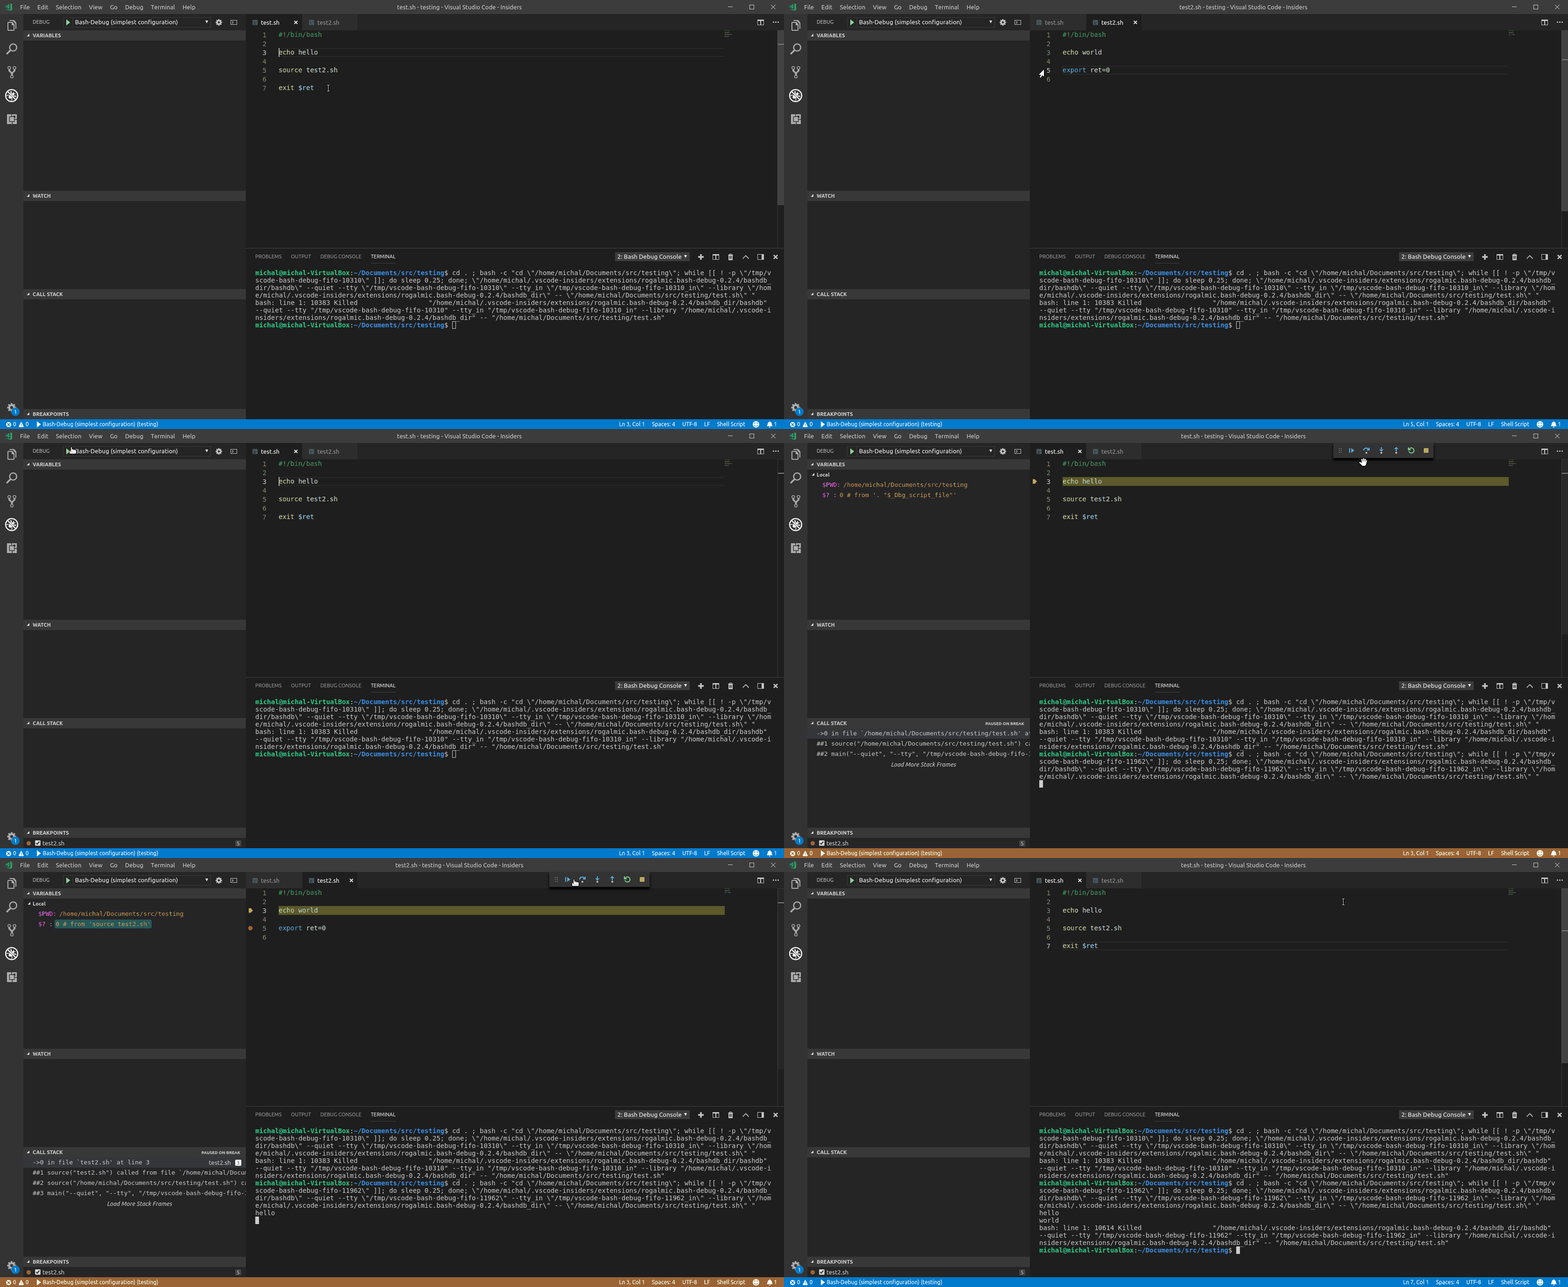
A zsh debugger GUI frontend based on awesome zshdb scripts (zshdb included in package).
This is a SIMPLE zshdb debugger frontend. Useful for learning zsh shell usage and writing simple scripts.
Useful hint: shellcheck extension does a great job with finding common script errors before debugging.
- Select Debug -> Add Configuration to add custom debug configuration (drop-down, path-input, etc...)
- Select Debug -> Start Debugging (F5) to start debugging
See https://code.visualstudio.com/docs/editor/debugging for general usage.
- Debugging auto-configuration via
launch.json
- Simple debugging in hello world application
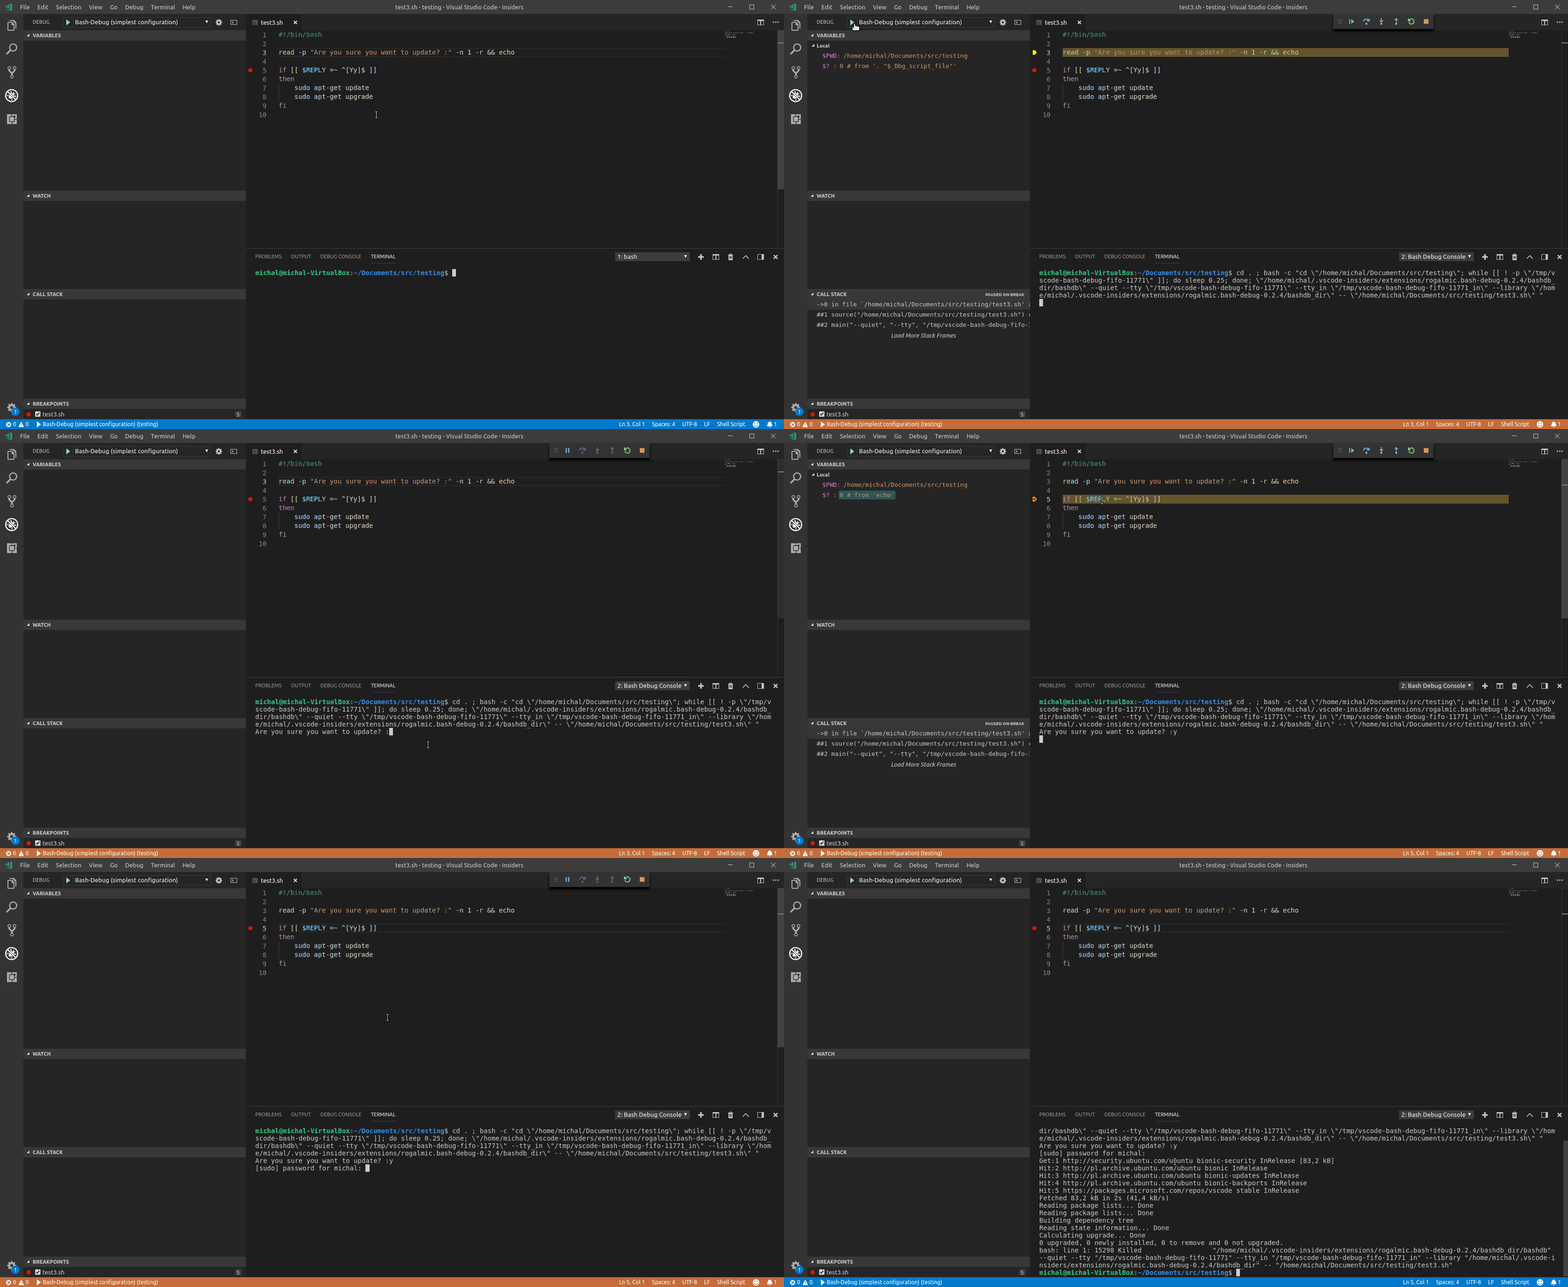
- Standard input handling via terminal
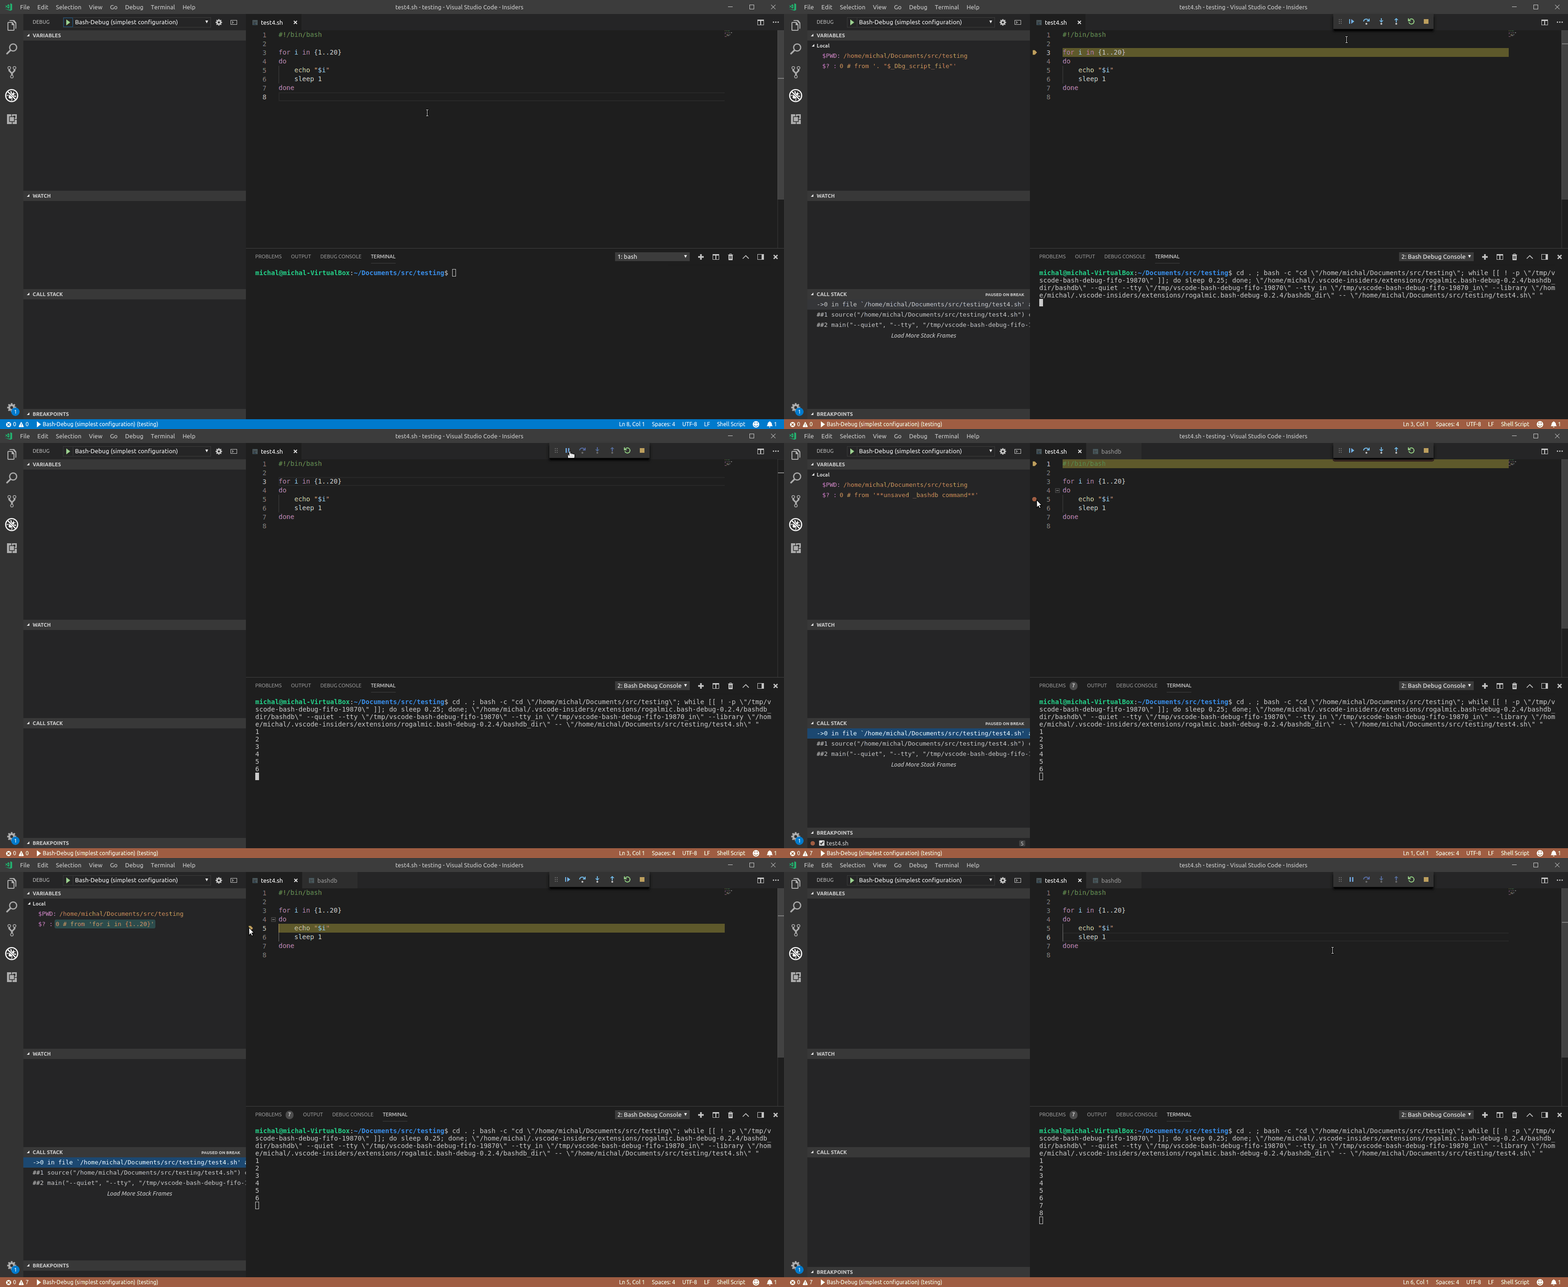
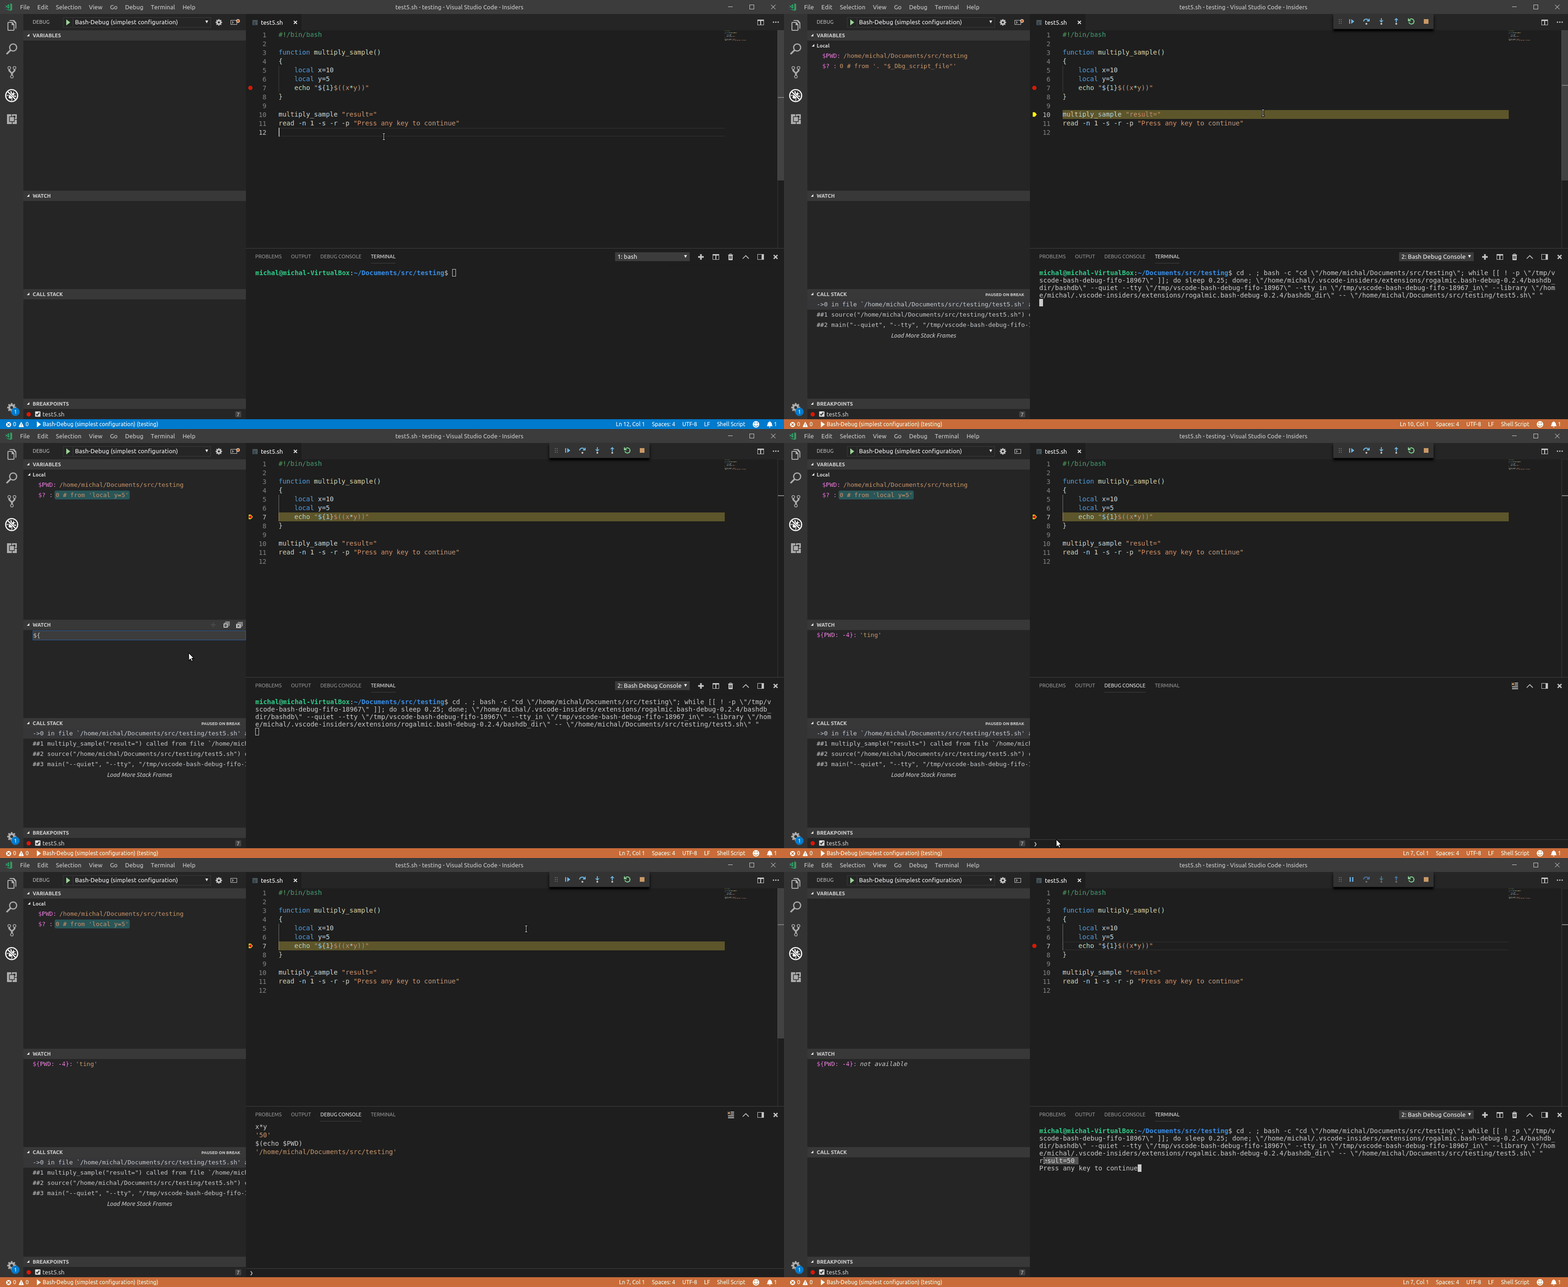
- Pause support while script is running
- Advanced "Watch" and "Debug console" usage
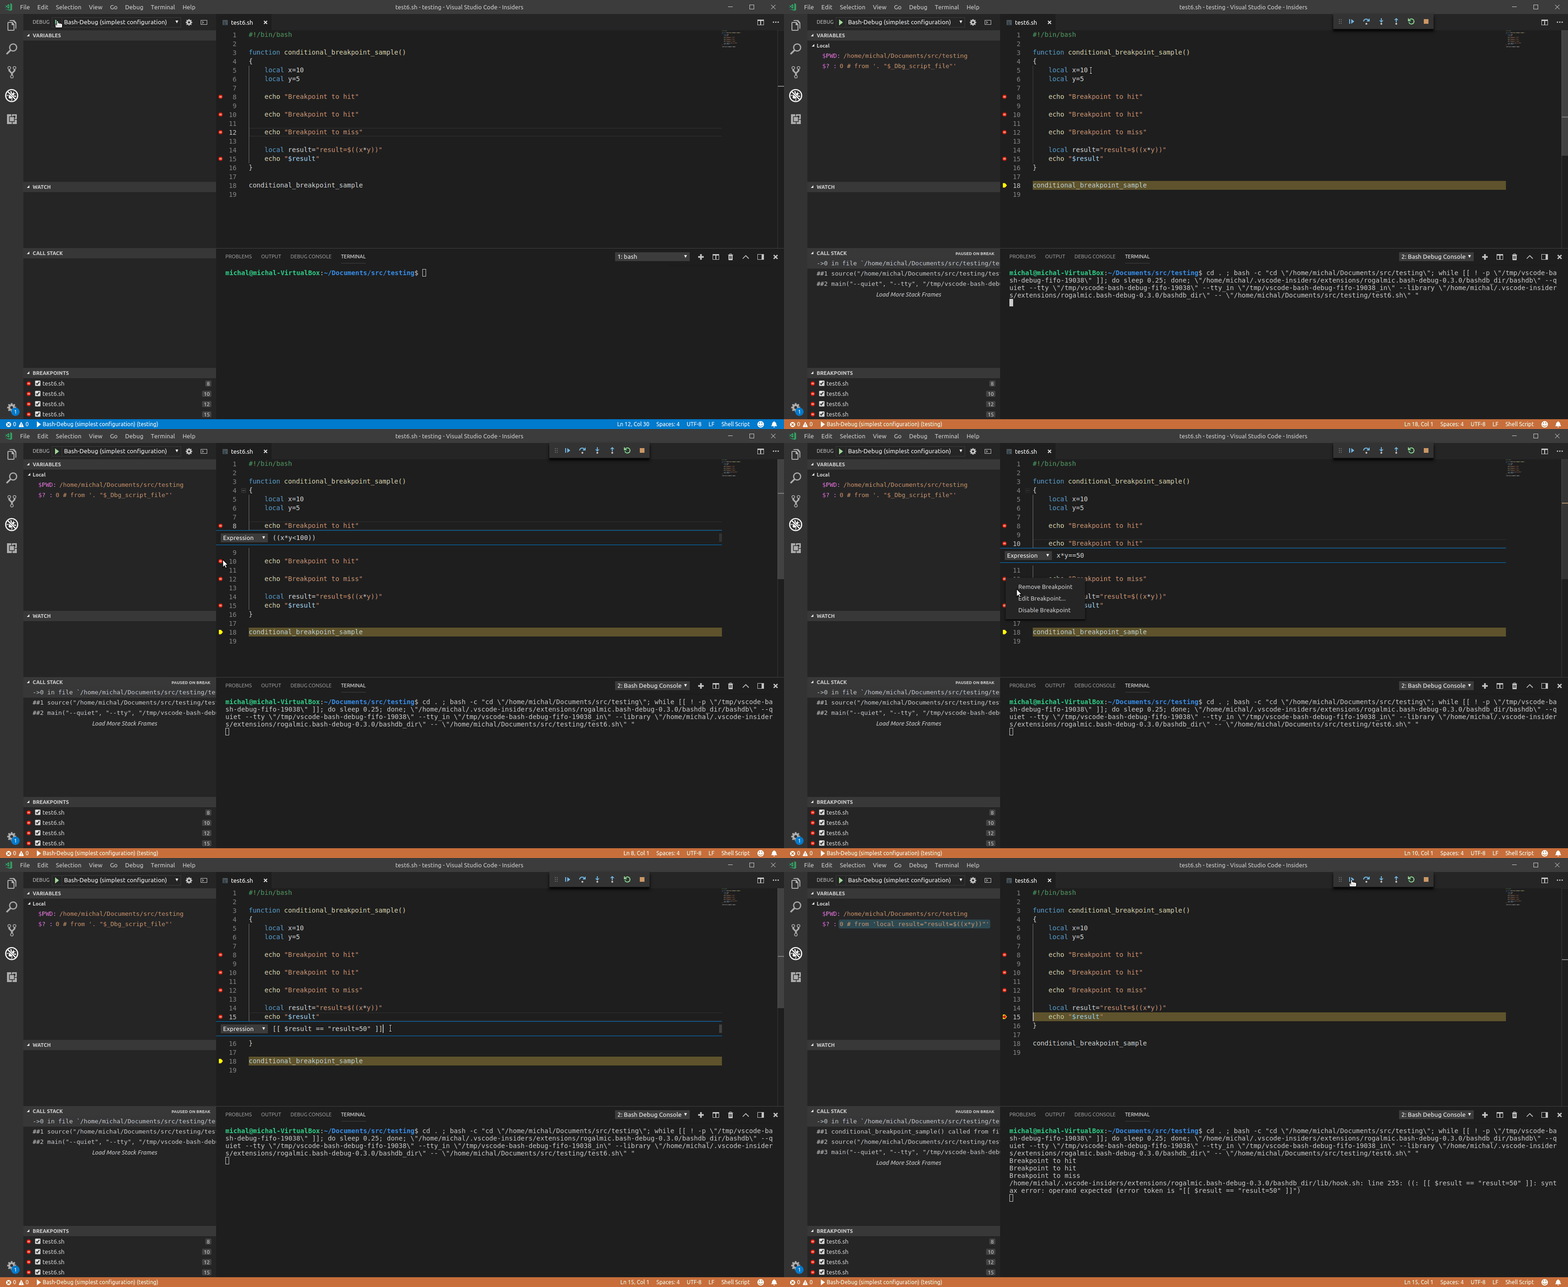
- Conditional breakpoints usage
For Windows users:
- Install Windows Subsystem for Linux
- Terminal has problems with spaces in paths when powershell is used, use WSL shell instead. For beta WSL please read this
- for now, debugging fails with
zsh:15: nice(5) failed: operation not permitted(microsoft/WSL#1838)
For macOS users:
- Read here if your mac has
/usr/local/bin/pkill.
zshversion4.3.6-dev-2or latercat,mkfifo,rm,pkill
- Use
terminalKind@launch.jsonset tointegratedorexternalfor interactive scripts (using stdin) - Currently debugger stops at first command
$0variable shows path to zshdb
