-
Notifications
You must be signed in to change notification settings - Fork 7
/
01-readr.Rmd
112 lines (87 loc) · 2.62 KB
/
01-readr.Rmd
1
2
3
4
5
6
7
8
9
10
11
12
13
14
15
16
17
18
19
20
21
22
23
24
25
26
27
28
29
30
31
32
33
34
35
36
37
38
39
40
41
42
43
44
45
46
47
48
49
50
51
52
53
54
55
56
57
58
59
60
61
62
63
64
65
66
67
68
69
70
71
72
73
74
75
76
77
78
79
80
81
82
83
84
85
86
87
88
89
90
91
92
93
94
95
96
97
98
99
100
101
102
103
104
105
106
107
108
109
110
111
112
---
title: "01-readr"
author: "Silvia P. Canelón"
date: "9/19/2020"
output: html_document
---
class: penguin-tour
```{r, echo=FALSE, out.width=1200}
knitr::include_graphics("images/pptx/01-readr.png")
```
.footnote[<span>Photo by <a href="https://unsplash.com/@eadesstudio?utm_source=unsplash&utm_medium=referral&utm_content=creditCopyText">James Eades</a> on <a href="https://unsplash.com/collections/12240655/palmerpenguins/d5aed8c855e26061e5e651d3f180b76d?utm_source=unsplash&utm_medium=referral&utm_content=creditCopyText">Unsplash</a></span>
]
---
background-image: url(images/hex/readr.png)
background-position: 1050px 50px
background-size: 80px
# readr: info
.panelset[
.panel[.panel-name[Overview]
.pull-left[
### Importing data is the very first step! <br/> You can use `readr` to import rectangular data.
]
.pull-right[
### You can import...
- comma separated (CSV) files with `read_csv()`
- tab separated files with `read_tsv()`
- general delimited files with `read_delim()`
- fixed width files with `read_fwf()`
- tabular files where columns are separated by white-space with `read_table()`
- web log files with `read_log()`
]
]
.panel[.panel-name[Cheatsheet]
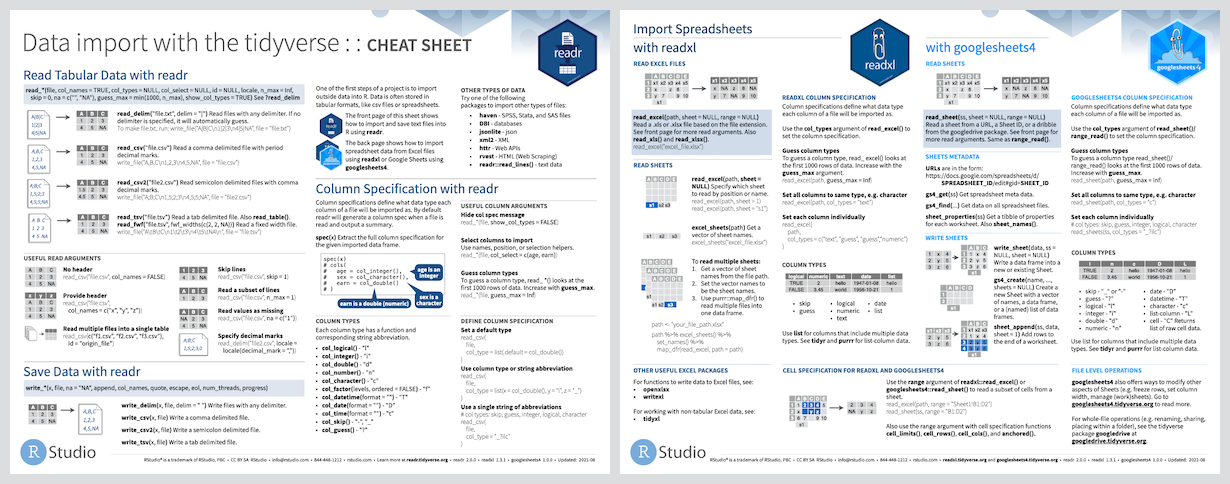
`r icon::fa("file-pdf")` PDF: https://github.com/rstudio/cheatsheets/raw/master/data-import.pdf

]
.panel[.panel-name[Reading]
.left-column[
```{r echo=FALSE}
knitr::include_graphics("images/r4ds-cover.png")
```
]
.right-column[
### R for Data Science: [Ch 11 Data import](https://r4ds.had.co.nz/data-import.html)
### Package documentation: https://readr.tidyverse.org/
]
]
]
---
background-image: url(images/hex/readr.png)
background-position: 1050px 50px
background-size: 80px
# readr: exercise
.panelset[
.panel[.panel-name[Read data in]
.center[
### Both options below will get you the same dataset!]
Option 1
```{r}
# option 1: load using URL ----
raw_adelie_url <- read_csv("https://portal.edirepository.org/nis/dataviewer?packageid=knb-lter-pal.219.3&entityid=002f3893385f710df69eeebe893144ff")
```
Option 2
```{r}
# option 2: load using filepath ----
raw_adelie_filepath <- read_csv("tutorial/raw_adelie.csv")
```
]
.panel[.panel-name[Save data]
Lucky for us, the `palmerpenguins` `r emo::ji("package")` compiles data from all three species together for us!
.pull-left[
`penguins` contains a clean dataset
```{r}
# saves package tibble into global environment
penguins <- palmerpenguins::penguins
head(penguins)
```
]
.pull-right[
`penguins_raw` contains raw data
```{r}
penguins_raw <- palmerpenguins::penguins_raw
head(penguins_raw)
```
]
]
]