Here are example interferogram stacks pre-processed using different InSAR processors.
Area: Fernandina volcano at Galápagos Islands, Ecuador
Data: Sentinel-1 A/B descending track 128 during Dec 2014 - June 2018 (98 acquisitions; Zenodo)
Size: ~750 MB
wget https://zenodo.org/record/2748487/files/FernandinaSenDT128.tar.xz
tar -xvJf FernandinaSenDT128.tar.xz
cd FernandinaSenDT128/mintpy
smallbaselineApp.py ${MINTPY_HOME}/docs/examples/input_files/FernandinaSenDT128.txt
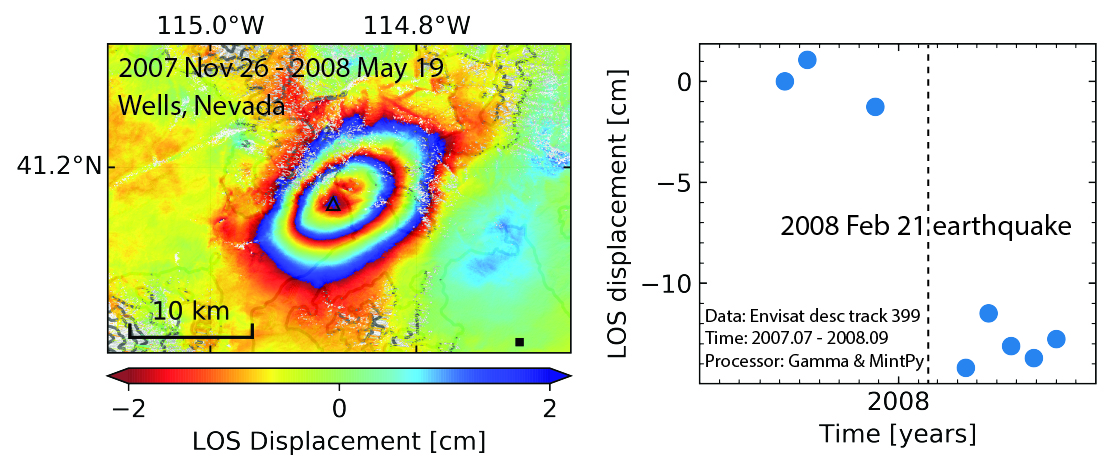
Area: Wells, Nevada, USA
Data: Envisat ASAR descending track 399 during July 2007 - September 2008 (11 acquisitions; Zenodo)
Size: ~280 MB
wget https://zenodo.org/record/2748560/files/WellsEnvD2T399.tar.xz
tar -xvJf WellsEnvD2T399.tar.xz
cd WellsEnvD2T399/mintpy
smallbaselineApp.py ${MINTPY_HOME}/docs/examples/input_files/WellsEnvD2T399.txt
Relevant literature:
- Nealy, J. L., H. M. Benz, G. P. Hayes, E. A. Bergman, and W. D. Barnhart (2017), The 2008 Wells, Nevada, Earthquake Sequence: Source Constraints Using Calibrated Multiple‐Event Relocation and InSARThe 2008 Wells, Nevada, Earthquake Sequence: Source Constraints Using Calibrated Multiple‐Event Relocation, Bulletin of the Seismological Society of America, 107(3), 1107-1117, doi:10.1785/0120160298.
Area: Kuju volcano at Kyushu island, SW Japan
Data: ALOS-1 PALSAR ascending track 422 during January 2007 - January 2011 (24 acquisitions; Zenodo)
Size: ~240 MB
wget https://zenodo.org/record/2748170/files/KujuAlosAT422F650.tar.xz
tar -xvJf KujuAlosAT422F650.tar.xz
cd KujuAlosAT422F650/mintpy
smallbaselineApp.py ${MINTPY_HOME}/docs/examples/input_files/KujuAlosAT422F650.txt
Relevant literature:
- Nakaboh, M., H. Ono, M. Sako, Y. Sudo, T. Hashimoto, and A. W. Hurst (2003), Continuing deflation by fumaroles at Kuju Volcano, Japan, Geophysical Research Letters, 30(7), doi:10.1029/2002gl016047.
- Ishitsuka, K., T. Tsuji, T. Matsuoka, J. Nishijima, and Y. Fujimitsu (2016), Heterogeneous surface displacement pattern at the Hatchobaru geothermal field inferred from SAR interferometry time-series, International Journal of Applied Earth Observation and Geoinformation, 44, 95-103, doi:10.1016/j.jag.2015.07.006.
Check the auto plotted figures in mintpy/pic folder, and modify the plotting parameters to adjust your plotting, and re-run the plotting script to update your plotting result:
./plot_smallbaselineApp.sh


