-
-
Notifications
You must be signed in to change notification settings - Fork 258
Home
An An edited this page Aug 24, 2017
·
1 revision
Welcome to the AAChartKit-Swift wiki!
- step one: configure the AAChartView
     aaChartView = AAChartView()
        let chartViewWidth = view.frame.size.width
        let chartViewHeight = view.frame.size.height - 220
        aaChartView?.frame = CGRect(x: 0,
                                    y: 60,
                                    width: chartViewWidth,
                                    height: chartViewHeight)
        ///AAChartView的内容高度(内容高度默认和 AAChartView 等高)
        aaChartView?.contentHeight = chartViewHeight - 20
        view.addSubview(aaChartView!)
        aaChartView?.scrollEnabled = false//禁止图表内容滚动
aaChartView?.isClearBackgroundColor = true- step two: configure the AAChartModel
        aaChartModel = AAChartModel()
            .chartType(chartType!)//图形类型
            .colorsTheme(["#1e90ff","#ef476f","#ffd066","#04d69f","#25547c",])//主题颜色数组
            .axisColor("#ffffff")
            .title("")//图形标题
            .subtitle("")//图形副标题
            .dataLabelEnabled(false)//是否显示数字
            .tooltipValueSuffix("℃")//浮动提示框单位后缀
            .animationType(.bounce)//图形渲染动画类型为"bounce"
            .backgroundColor("#22324c")//若要使图表背景色为透明色,可将 backgroundColor 设置为 "rgba(0,0,0,0)" 或 "rgba(0,0,0,0)". 同时确保 aaChartView?.isClearBackgroundColor = true
            .series([
                AASeriesElement()
                    .name("Tokyo")
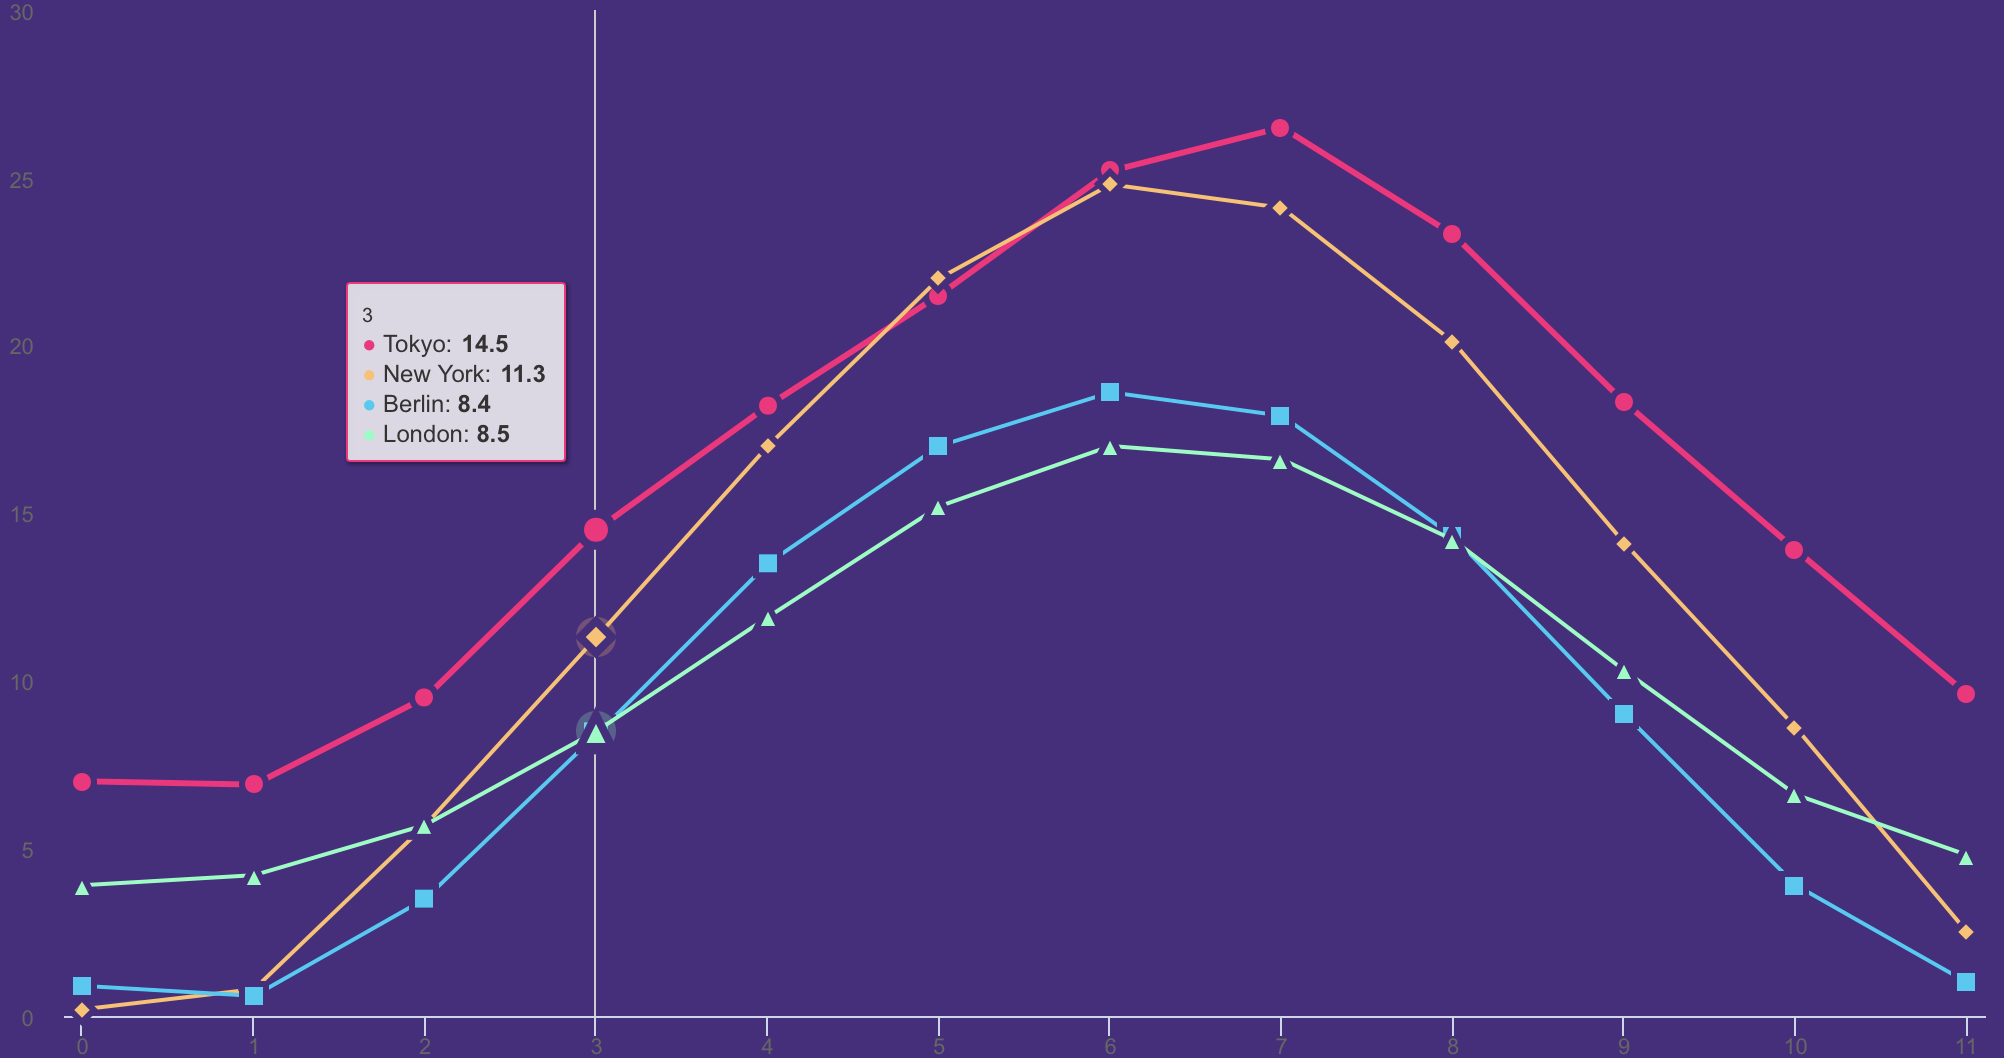
                    .data([7.0, 6.9, 9.5, 14.5, 18.2, 21.5, 25.2, 26.5, 23.3, 18.3, 13.9, 9.6])
                    .toDic()!,
                AASeriesElement()
                    .name("New York")
                    .data([0.2, 0.8, 5.7, 11.3, 17.0, 22.0, 24.8, 24.1, 20.1, 14.1, 8.6, 2.5])
                    .toDic()!,
                AASeriesElement()
                    .name("Berlin")
                    .data([0.9, 0.6, 3.5, 8.4, 13.5, 17.0, 18.6, 17.9, 14.3, 9.0, 3.9, 1.0])
                    .toDic()!,
                AASeriesElement()
                    .name("London")
                    .data([3.9, 4.2, 5.7, 8.5, 11.9, 15.2, 17.0, 16.6, 14.2, 10.3, 6.6, 4.8])
                    .toDic()!,
])- step three: draw chart with the AAChartModel
aaChartView?.aa_drawChartWithChartModel(aaChartModel!)the final chart picture
