Background • Tech stack overview • Features • Building • New data ingest instructions • Deployment instructions
Data management • Exporting data for Geo& • Data properties stored in DB • Trend analysis notes • Contributing
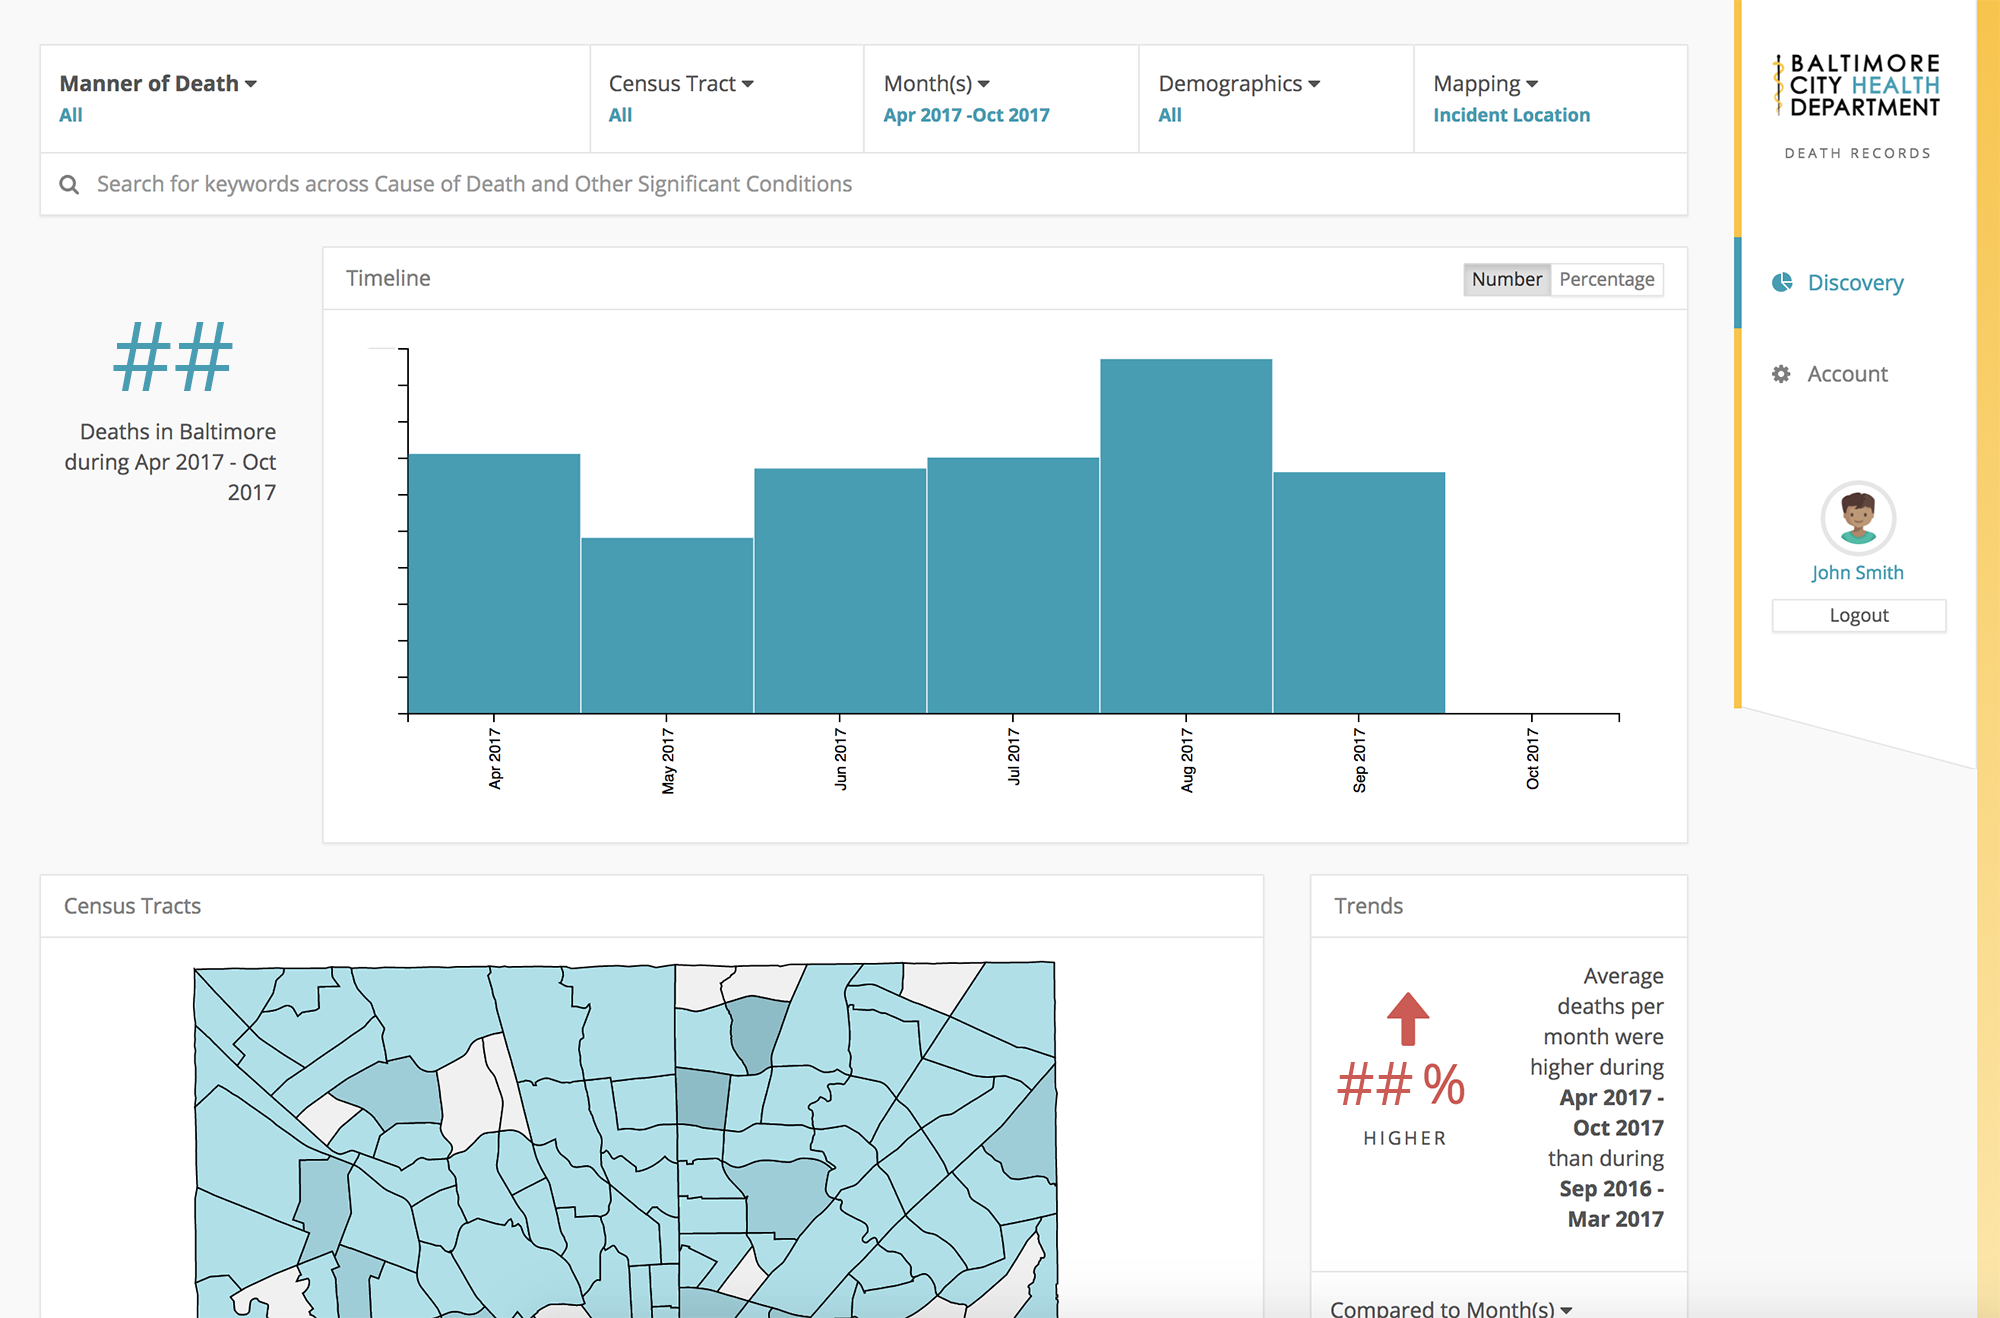
In 2016, the Baltimore City Health Department (BCHD) launched the TECHealth program and innovation fund with the goal of using technology to better understand and address health disparities in the city. As a grant awardee and member of the TECHealth cohort, Fearless created a dashboard for BCHD to track public health trends and correlate them with environmental and social factors. Within the 8-week timeline given by BCHD, we leveraged the MEAN stack, D3 visualization library, Postgres, and our powerful Geo& data engine to build a prototype dashboard that can automatically ingest data and create powerful visual representations of public health trends across Baltimore’s hundreds of neighborhoods. For more context, see our case study here.
Fearless is a Baltimore-based, community-focused company with a lot of love for our city and a desire to share this project with the community at large under the GPLv3 license. We encourage others in the community to contribute to this project and help BCHD more efficiently serve its citizens.
- MEAN.js
- MongoDB
- Express
- Angular
- Node
- PostgreSQL
- D3
- Automated metrics and sleek visualizations of public health trends by census tract, allowing analysts to filter results based on location and demographic information and receive results in seconds.
- Automated data ingest process offers snapshots of public health as soon as new data is received.
- At-a-glance visual comparison between current and historical data, which allows users to detect trends such as spikes and sudden drops in incidence rates of public health indicators so they can understand how trends and patterns change from year to year.
- In one terminal, run:
yarn installto get dependencies - In another terminal, run:
mongodto launch mongo, must be running a version greater than 5.0.0 - Set environment variables for the following values, filling in the appropriate values
- export PS_BCHD_URI=''
- export SESSION_SECRET=''
- export CSRF_P3P=''
- export MAPZEN_API_KEY=''
- export MONGO_SEED_USER_USERNAME=''
- export MONGO_SEED_USER_EMAIL=''
- export MONGO_SEED_ADMIN_USERNAME=''
- export MONGO_SEED_ADMIN_EMAIL=''
- export MONGODB_URI_DEV=''
- export MONGODB_URI=''
gulp ingest --file scripts/ingest/ocme-2017-09-11.csvto populate the mock data- Arguments
- The arguments for this task are the file name
--fileand an optional timeout parameter--timeout. The timeout parameter specifies a wait period in milliseconds between each db write. If absent, the default is 200. The timeout is necessary for throttling calls to the MapZen geocoding API for when that function is necessary. If the ingest table has addresses but no coordinates, then thetimeoutshould be no less than 200. If the ingest csv already has latitude and longitude along with addresses, then calls to the geocoder will be automatically skipped and thetimeoutcan be set to zero.
- The arguments for this task are the file name
- Arguments
cd scripts/mongo-load; sh load-data-into-mongo.shto populate the typeahead tablenpm startto launch the service- Navigate to
http://localhost:3000to see the app - You can also view it on your mobile device if you are on the same wifi network but getting the IP of your machine running node and visiting
xxx.xxx.xxx.xxx:3000on your phone.
- Export OCME records to CSV. An example of the CSV column format is located in
scripts/ingest/ocme-2017-09-11.csv - Give this file a simple name with no spaces, for example:
ocme-dec-2017.csv - Copy this file to the folder
scripts/ingest - Open the Git Bash terminal and navigate to the dashboard root folder:
cd /c/Temp/<dashboard_folder_name>
- Run the command
gulp ingest --file script/ingest/ocme-dec-2017.csv(or whatever the name of the new file is) - This will take about 5 - 10 minutes per 1,000 rows in the CSV since it has to make multiple calls to the geocoder service and the census tract geo-database before writing a new record to the dashboard db. The ingest task will tick off a prompt every 10 rows as it is making progress.
- Once the gulp ingest task is done, it will end itself and return back to the prompt in the Git Bash terminal. The Git Bash terminal window can be closed.
- The new OCME records will be appended to the of the existing database. In the event that a new OCME record has the same case number as a record already in the database, the new record will overwrite the old record for that case number.
- The deployment procedure for the application are done using Shipit, which is a node module that is installed as part of the node modules
- In order to make use of it via the command line, first run
npm i -g shipit-cli - Shipit recently also requires npx to run commands
- To deploy, first run
npx shipit staging deploy- If you'd like to deploy a specific branch, you can append
-r <revision>to the end of the above command - The default branch will be
develop
- If you'd like to deploy a specific branch, you can append
- Once this is done, you should then stop and start the application:
- Stop:
npx shipit staging stop-app - Start:
npx shipit staging start-app
- Stop:
- If necessary, you can drop and ingest the data in the DB using the following commands:
- Drop:
npx shipit staging dropdb - ingest:
npx shipit staging ingest-db
- Drop:
Run the gulp task gulp export_to_csv, this will create a file death-records-export-YYYY_MM_DD-hh_mm_ss.csv in the app root that is a PII-safe pipe delimited dump of the mongo db. That can then be manually transferred over to the Geo& ingest process.
To protect PII, only certain fields that are needed to support the dashboard app and Geo& are saved into the Mongo db. This pii-safe mode can be configured in config/env/default.js or for a particular environment by setting the flag db.pii_safe. Setting this value to true will mean that PII is not saved to the database and that the precision of latitude/longitude geocoded address coordinates is reduced based on the config value db.pii_safe_latlng_precision. The default latitude/longitude precision is 4, which means that the real address is roughly within a 25' radius around the coordinate. Setting this value to false means that all values are stored in the db and that latitude/longitude coordinates are kept at full precision (6).
It is unlikely that the correct real address can be reverse geocoded from coordinates alone, especially if precision is reduced as when pii_save: true is set. Even with 6 decimals of precision, a reverse geocoding of coordinates could still return an address several doors up or down from the original address. Geocoding and then reverse geocoding with different geocoding services will also return different results, further reducing the liklihood that the exact original address would be obtained from coordinates alone.
The following fields are stored to the db with pii_safe: true
- caseNumber
- caseType
- sex
- causeOfDeath
- otherSignificantCondition
- injuryDescription
- yearOfDeath
- monthOfDeath
- yearMonthOfDeath
- reportSignedDate
- ageInYearsAtDeath
- mannerOfDeath
- drugRelated:
- isDrugRelated
- drugsInvolved
- incidentLocation:
- longitude (reduced to 4 decimal places)
- latitude (reduced to 4 decimal places)
- censusTract (of original coordinates)
- totalPopulation2010 (of censusTract)
- residenceLocation:
- longitude (reduced to 4 decimal places)
- latitude (reduced to 4 decimal places)
- censusTract (of original coordinates)
- totalPopulation2010 (of censusTract)
- homeless
- race
If pii_safe: false, latitude/longitude values are stored 6 decimal places of precision (about one house) and the following fields are included:
- lastName
- firstName
- middleInitial
- suffix
- dateOfBirth
- yearOfBirth
- dateOfDeath
- incidentLocation:
- street
- city
- county
- state
- zipcode
- addressString
- residenceLocation:
- street
- city
- county
- state
- zipcode
- addressString
Refer to trend analysis notes for additional information about trend analysis research and implementation for the app.
Contributions are welcome! Please see the contribution guidelines first.


