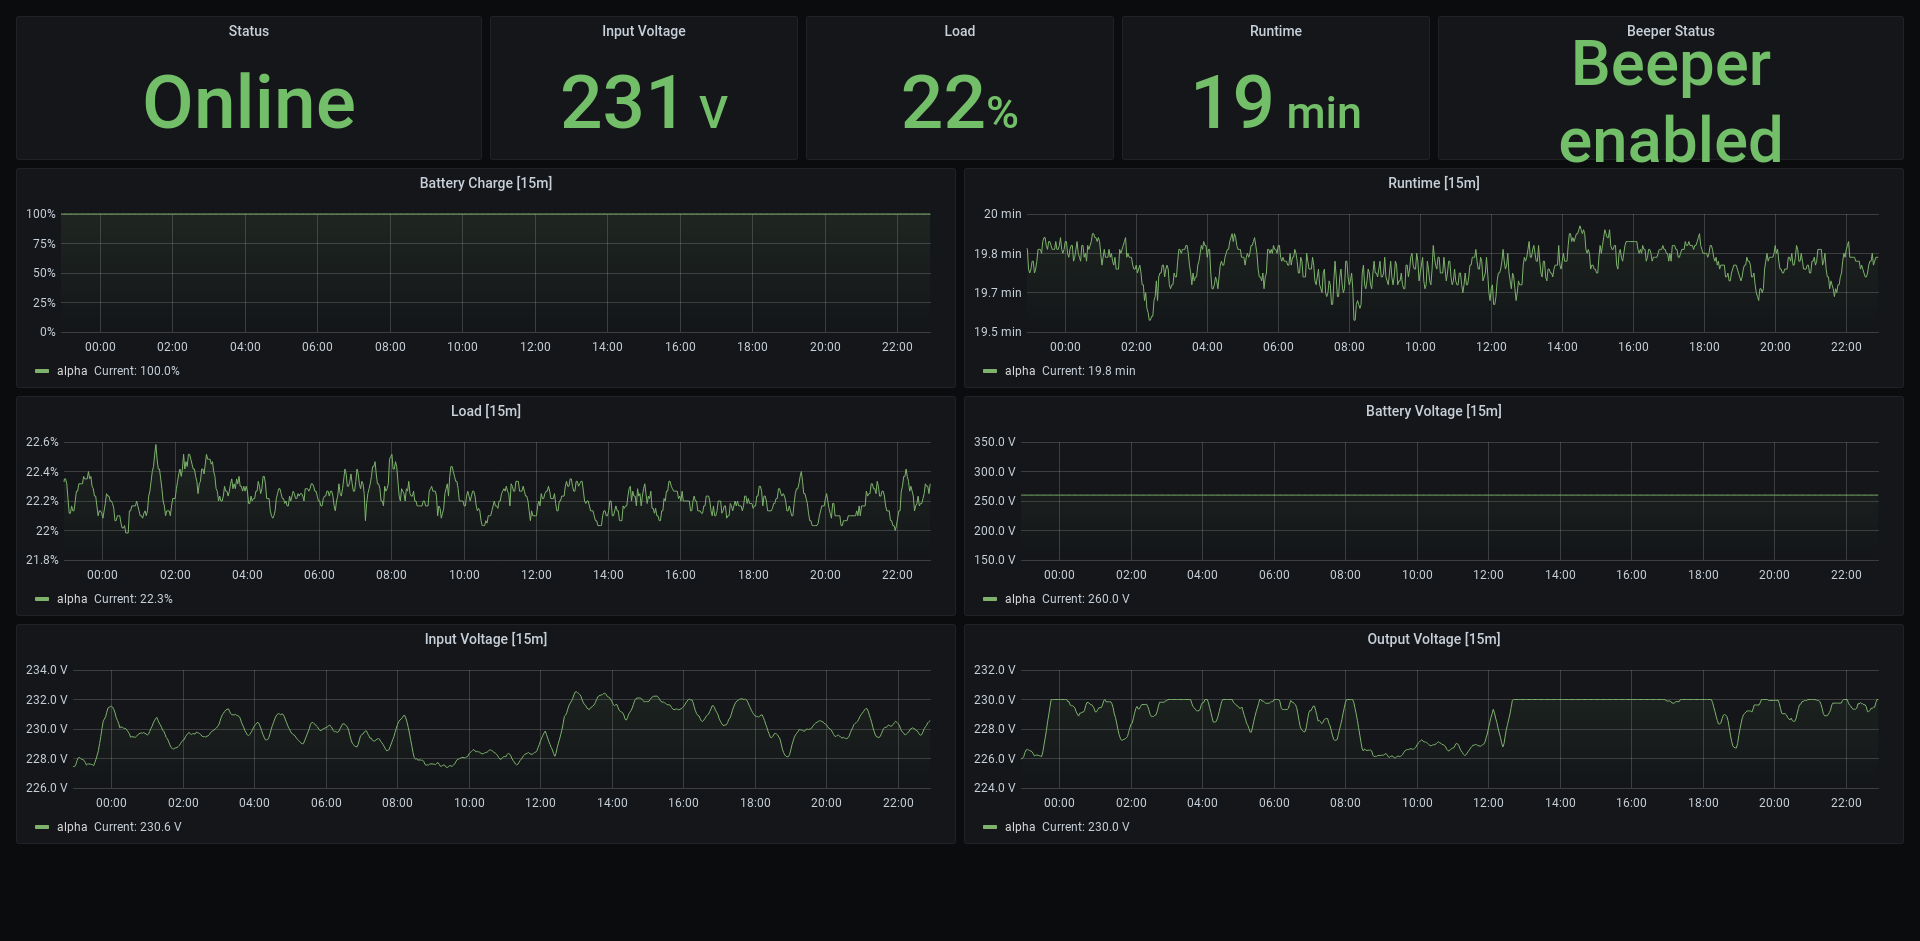
A Prometheus/OpenMetrics exporter for uninterruptable power supplies (UPSes) using Network UPS Tools (NUT).
Set up NUT in server mode and make sure the TCP port (3493 by default) is accessible (without authentication).
If you want to test that it's working, run telnet <nut-server> 3493 and then VER, LIST UPS and LIST VAR <ups>.
Example docker-compose.yml:
version: "3.7"

services:
  nut-exporter:
    # Stable v1
    image: hon95/prometheus-nut-exporter:1
    environment:
      - TZ=Europe/Oslo
      - HTTP_PATH=/metrics
      # Defaults
      #- RUST_LOG=info
      #- HTTP_PORT=9995
      #- HTTP_PATH=/nut
      #- LOG_REQUESTS_CONSOLE=false
      #- PRINT_METRICS_AND_EXIT=false
    ports:
- "9995:9995/tcp"Example prometheus.yml:
global:
    scrape_interval: 15s
    scrape_timeout: 10s

scrape_configs:
  - job_name: "nut"
    static_configs:
      # Insert NUT server address here
      - targets: ["nut-server:3493"]
    metrics_path: /nut
    relabel_configs:
      - source_labels: [__address__]
        target_label: __param_target
      - source_labels: [__param_target]
        target_label: instance
      - target_label: __address__
        # Insert NUT exporter address here
        replacement: nut-exporter:9995
In the above example, nut-exporter:9995 is the address and port of the NUT exporter while nut-server:3493 is the address and port of the NUT server to query through the exporter.
Example container resources requests and limits. This was done by scraping one NUT server with two UPSes. Resource usage was observed across 7 days period. This can be lowered even more but should be sufficient as a starting point.
resources:
  limits:
    cpu: "10m"
    memory: "16Mi"
  requests:
    cpu: "1m"
memory: "8Mi"Use e.g. 1 for stable v1.y.z releases and latest for bleeding/dev/unstable releases.
RUST_LOG(defaults toinfo): The log level used by the console/STDOUT. Set todebugso show HTTP requests andtraceto show extensive debugging info.HTTP_ADDRESS(defaults to::): The HTTP server will listen on this IP. Set to127.0.0.1or::1to only allow local access.HTTP_PORT(defaults to9995): The HTTP server port.HTTP_PATH(defaults tonut): The HTTP server metrics path. You may want to set it to/metricson new setups to avoid extra Prometheus configuration (not changed here due to compatibility).PRINT_METRICS_AND_EXIT(defaults tofalse): Print a Markdown-formatted table consisting of all metrics and then immediately exit. Used mainly for generating documentation.
See metrics.
GNU General Public License version 3 (GPLv3).


