A monitoring solution for Near node runners and validators utilizing docker containers with Prometheus, Grafana, NodeExporter, NearPrometheusExporter, and alerting with AlertManager.
This is intended to be a single-stop solution for monitoring your NEAR validators and nodes.
Prerequisites:
- Docker Engine >= 1.13
- Docker Compose >= 1.11
Containers:
- Prometheus (metrics database)
http://<host-ip>:9090 - AlertManager (alerts management)
http://<host-ip>:9093 - Alertmanager-discord (disabled by default)
http://<host-ip>:9094 - Grafana (visualize metrics)
http://<host-ip>:3000- Infinity Plugin
- NodeExporter (host metrics collector)
- Caddy (reverse proxy and basic auth provider for prometheus and alertmanager)
Clone this repository on your Docker host, cd into near-monitoring directory and run compose up:
git clone https://github.com/LavenderFive/near-monitoring
cd near-monitoring

docker-compose up -d1. cp .env.sample .env
1. replace NEAR_NODE_URL with your URL
1. replace NEAR_ACCOUNT_ID with your pool ID
----- Caddy ------
1. under caddy/Caddyfile:
1. replace YOUR_WEBSITE.COM with your website
1. replace [email protected] with your email
1. point your dns to your monitoring server
----- Prometheus -----
1. under prometheus/prometheus.yml line 36
1. replace YOUR_IP with your server's IP address
----------------------
1. docker compose up -d
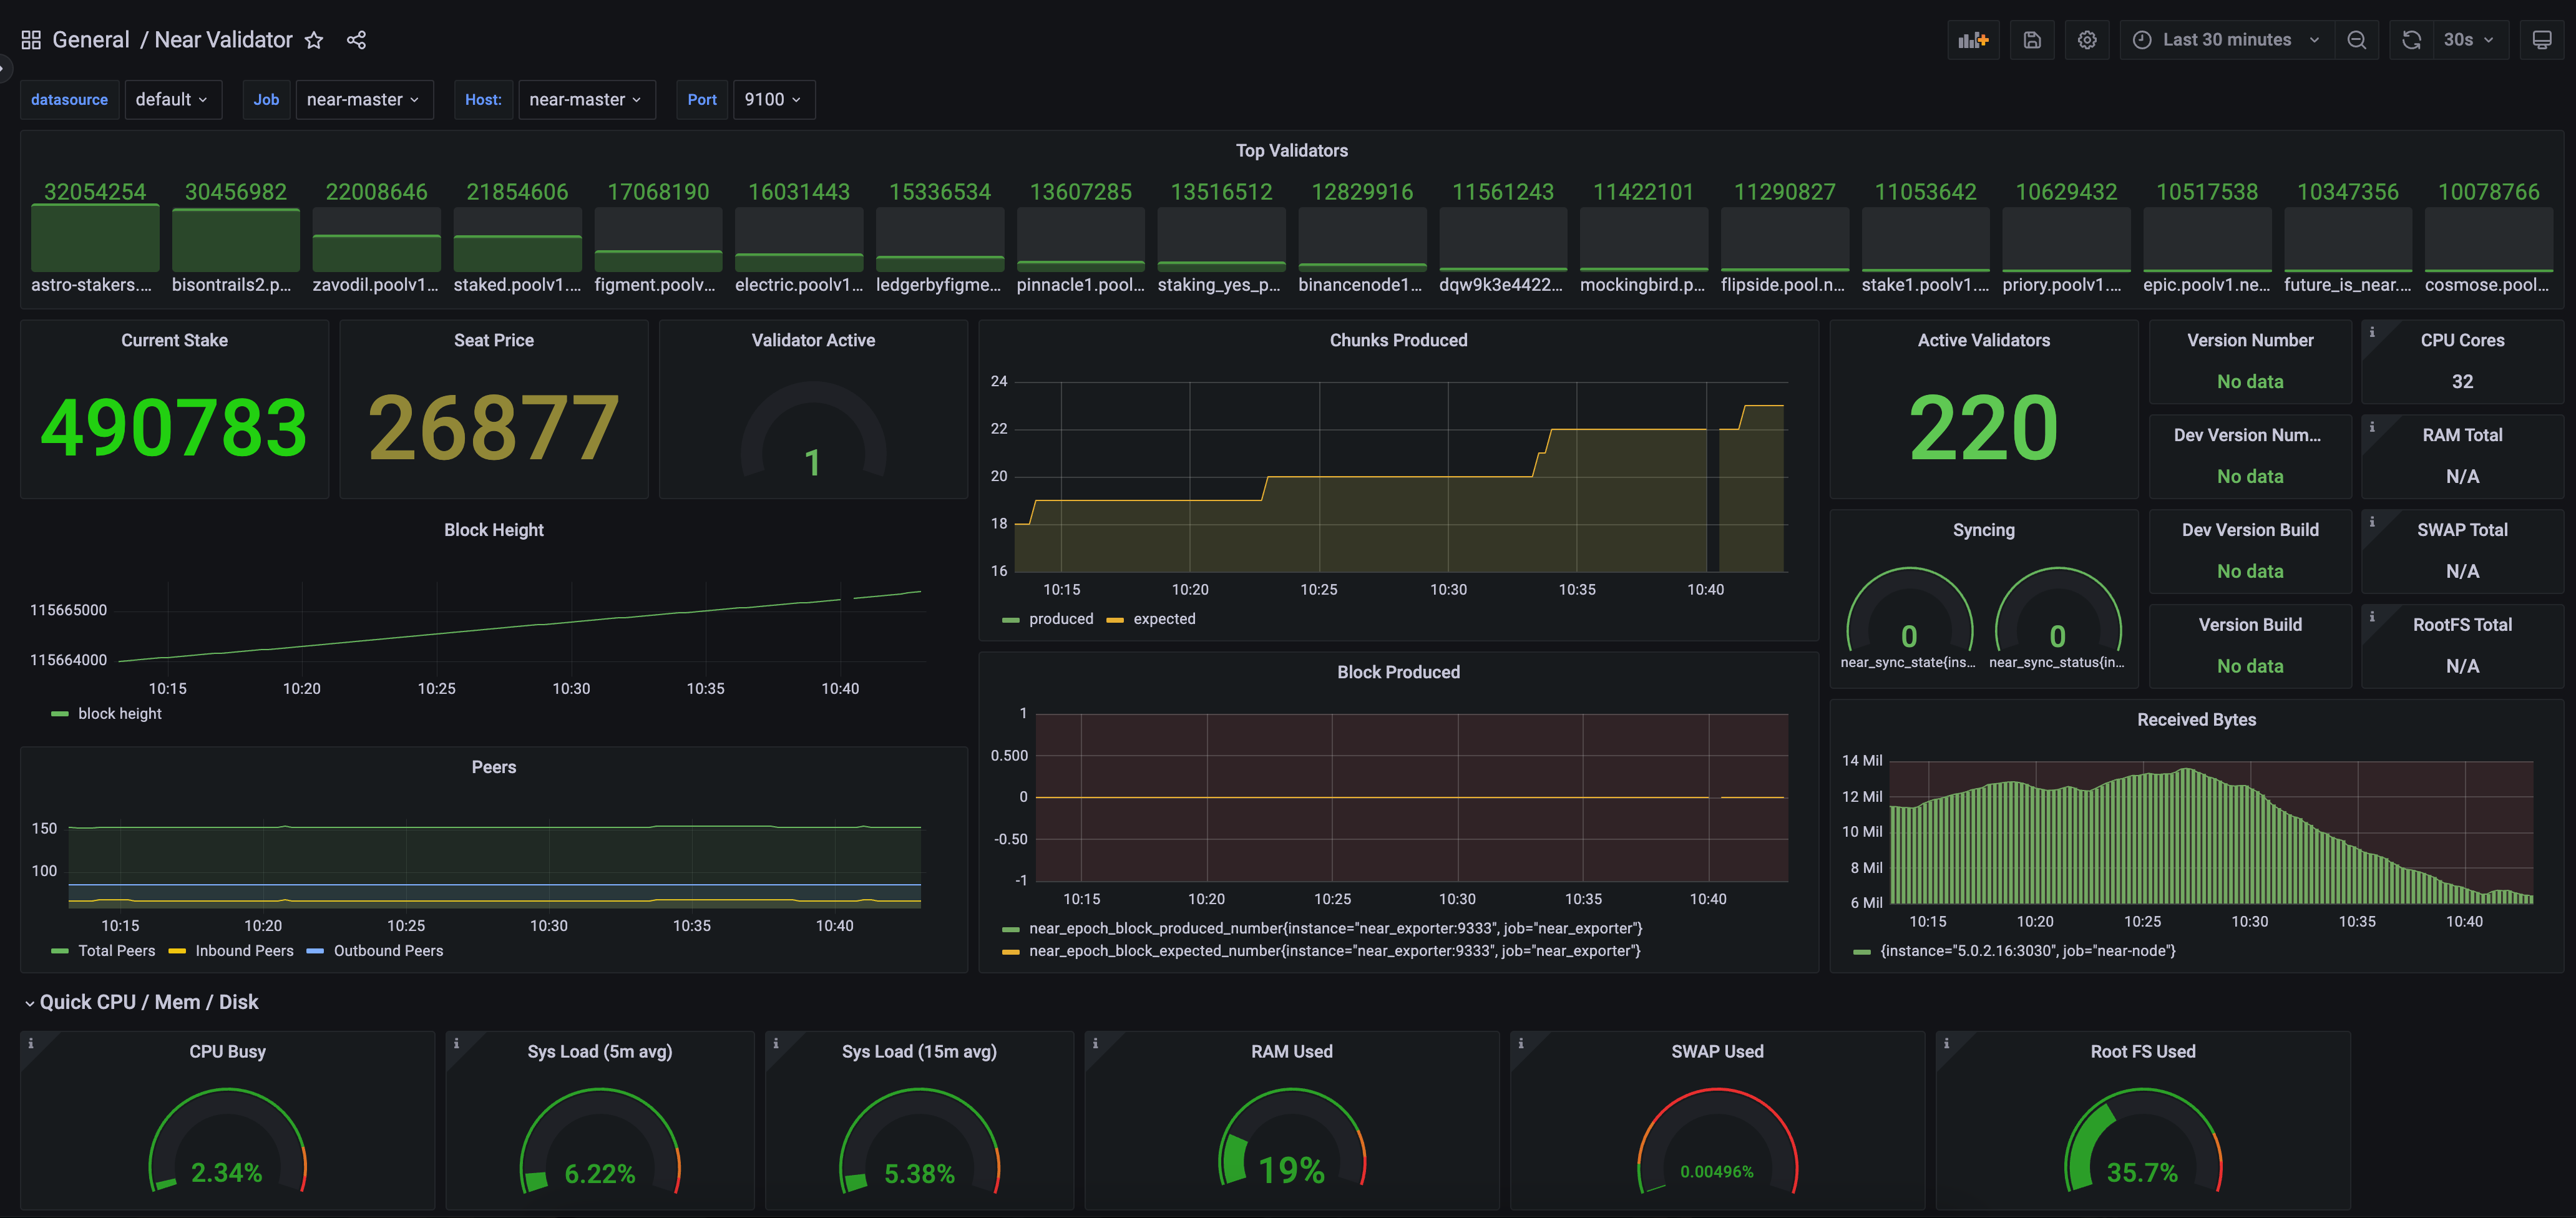
This monitoring solution comes built in with a very basic Peggo Monitoring dashboard, which works out of the box. Grafana, Prometheus, and Infinity are installed automatically.
To support persistent storage, you'll first need to create the volume:
docker volume create grafana-storage && docker volume create prometheus_data
Navigate to http://<host-ip>:3000 and login with user admin password admin. You can change the credentials in the compose file or by supplying the ADMIN_USER and ADMIN_PASSWORD environment variables on compose up. The config file can be added directly in grafana part like this
grafana:
  image: grafana/grafana:7.2.0
  env_file:
    - .env
and the config file format should have this content
GF_SECURITY_ADMIN_USER=admin
GF_SECURITY_ADMIN_PASSWORD=changeme
GF_USERS_ALLOW_SIGN_UP=false
If you want to change the password, you have to remove this entry, otherwise the change will not take effect
- grafana_data:/var/lib/grafanaGrafana is preconfigured with dashboards and Prometheus as the default data source:
- Name: Prometheus
- Type: Prometheus
- Url: http://prometheus:9090
- Access: proxy
Monitor Services Dashboard
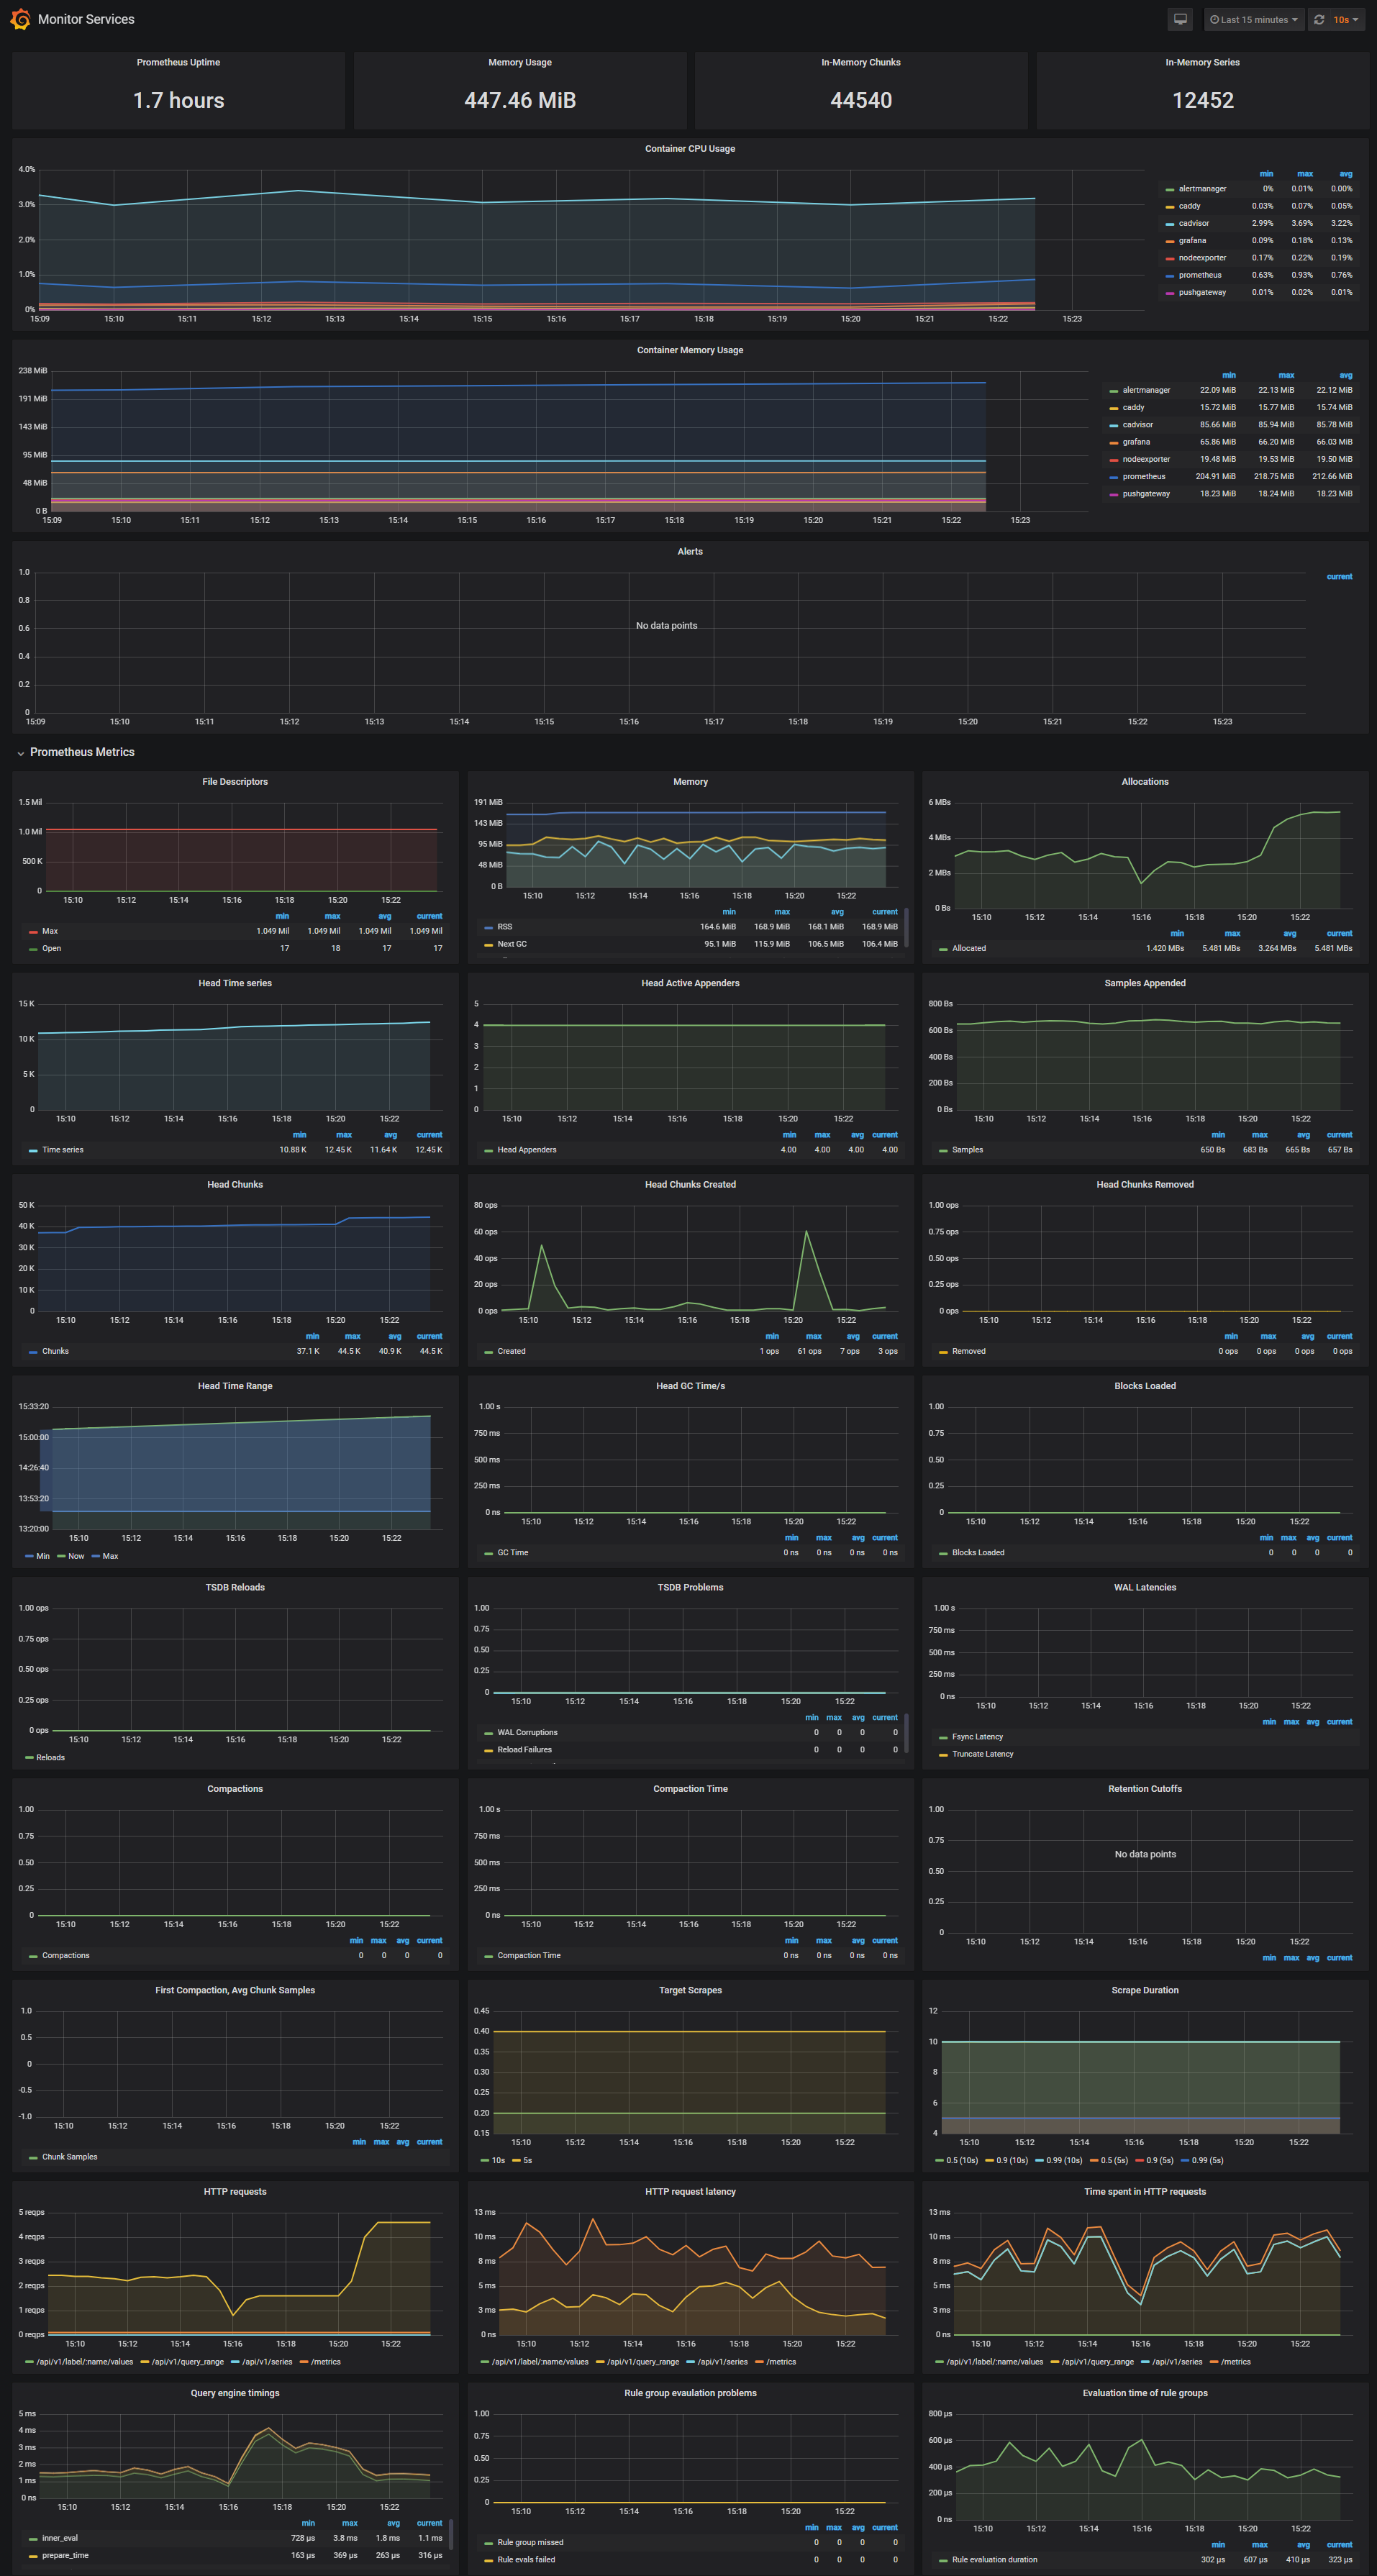
The Monitor Services Dashboard shows key metrics for monitoring the containers that make up the monitoring stack:
- Prometheus container uptime, monitoring stack total memory usage, Prometheus local storage memory chunks and series
- Container CPU usage graph
- Container memory usage graph
- Prometheus chunks to persist and persistence urgency graphs
- Prometheus chunks ops and checkpoint duration graphs
- Prometheus samples ingested rate, target scrapes and scrape duration graphs
- Prometheus HTTP requests graph
- Prometheus alerts graph
Two alert groups have been setup within the alert.rules configuration file:
You can modify the alert rules and reload them by making a HTTP POST call to Prometheus:
curl -X POST http://admin:admin@<host-ip>:9090/-/reloadMonitoring services alerts
Trigger an alert if any of the monitoring targets (node-exporter and cAdvisor) are down for more than 30 seconds:
- alert: monitor_service_down
    expr: up == 0
    for: 30s
    labels:
      severity: critical
    annotations:
      summary: "Monitor service non-operational"
      description: "Service {{ $labels.instance }} is down."
NEAR alerts
- name: Near Monitoring
  rules:
    - alert: NearVersionBuildNotMatched
      expr: near_version_build{instance="yournode.io", job="near"} != near_dev_version_build{instance="yournode.io", job="near"}
      for: 5m
      labels:
        severity: warning
        job: near
      annotations:
        summary: "Near Node Version needs updated."
        description: "Your version is out of date and you risk getting kicked."
    - alert: StakeBelowSeatPrice
      expr: abs((near_current_stake / near_seat_price) * 100) < 100
      for: 2m
      labels:
        severity: warning
        job: near
      annotations:
        description: 'Pool is below the current seat price'
    - alert: NearBlockNumberNotIncreasing
      expr: increase(near_block_number[5m]) <= 0
      for: 5m
      labels:
        severity: warning
        job: near
      annotations:
        summary: "Near Block Number Not Increasing"
        description: "The near_block_number has not increased in the last 5 minutes."
    - alert: NearChunkProducedNotIncreasing
      expr: >
        increase(near_epoch_chunks_produced_number[5m]) <= 0 and
        near_epoch_chunks_produced_number < near_epoch_chunks_expected_number and
        increase(near_epoch_chunks_produced_number[5m]) != increase(near_epoch_chunks_expected_number[5m])
      for: 5m
      labels:
        severity: warning
        job: near
      annotations:
        summary: "Near Chunks Produced Not Increasing"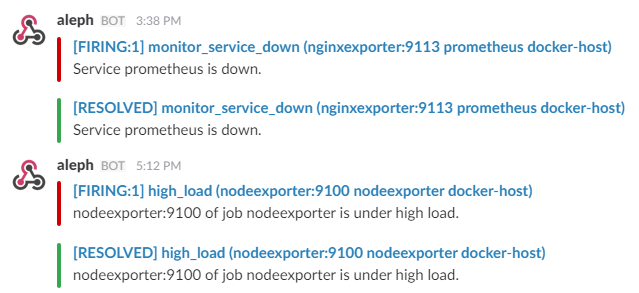
description: "The near_epoch_chunks_produced_number has not increased in the last 5 minutes."The AlertManager service is responsible for handling alerts sent by Prometheus server. AlertManager can send notifications via email, Pushover, Slack, HipChat or any other system that exposes a webhook interface. A complete list of integrations can be found here.
You can view and silence notifications by accessing http://<host-ip>:9093.
The notification receivers can be configured in alertmanager/config.yml file.
To receive alerts via Slack you need to make a custom integration by choose incoming web hooks in your Slack team app page. You can find more details on setting up Slack integration here.
Copy the Slack Webhook URL into the api_url field and specify a Slack channel.
route:
    receiver: 'slack'

receivers:
    - name: 'slack'
      slack_configs:
          - send_resolved: true
            text: "{{ .CommonAnnotations.description }}"
            username: 'Prometheus'
            channel: '#<channel>'
            api_url: 'https://hooks.slack.com/services/<webhook-id>'