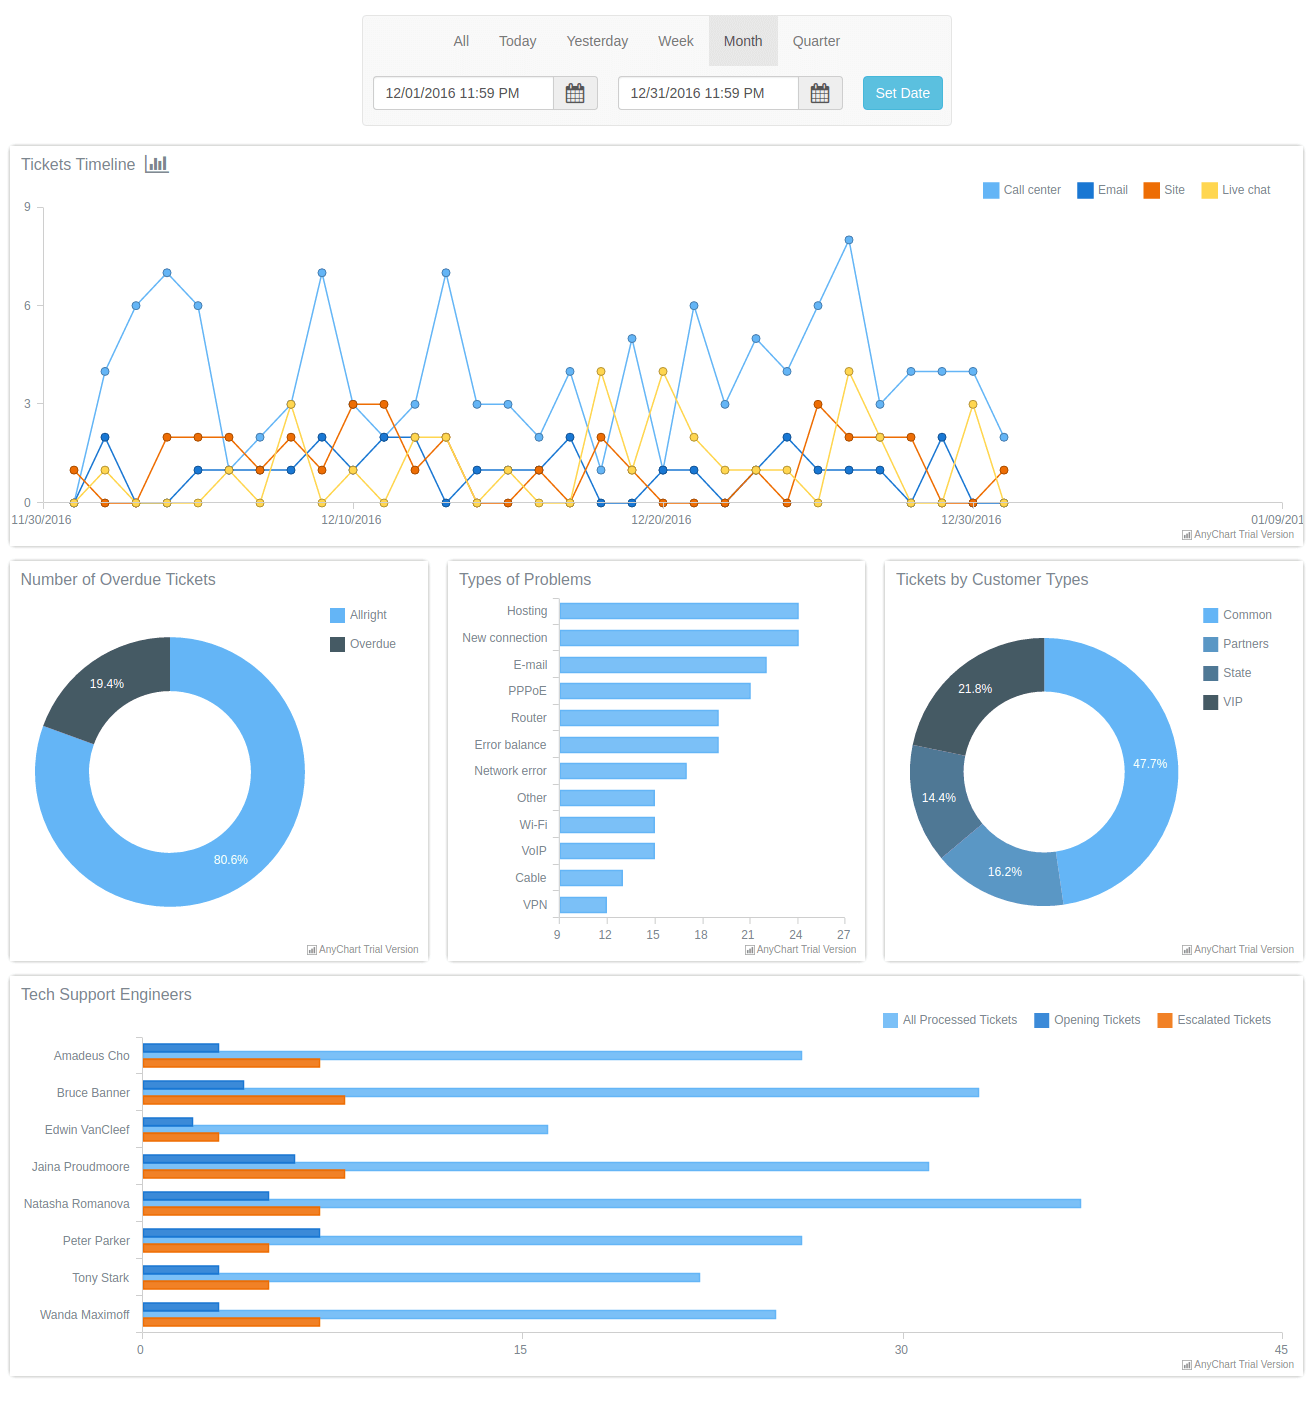
This dashboard is designed to help to organize the work of a support department. Essential indicators, such as the number of overdue tickets, types of problems, support engineers stats presented as simple to read charts. You won't need to find the information in separate places; everything is right in front of your eyes.
Clone this repository:
$ git clone [email protected]:anychart-solutions/technical-support-dashboard.git
Navigate to the solution directory:
$ cd technical-support-dashboard
Intall dependencies:
$ npm install
Open index.html in the browser.
- Technical Support Dashboard Demo at AnyChart.Com
- Documentation
- JavaScript API Reference
- Code Playground
- Technical Support
AnyChart solution sample includes two parts:
- code of the solution sample that allows to use Javascript library (in this case, AnyChart). You can use, edit, modify it, use it with other Javascript libraries without any restrictions. It is released under Apache 2.0 License
- AnyChart JavaScript library. It is released under Commercial license. You can test this plugin with the trial version of AnyChart. Our trial version is not limited by time and doesn't contain any feature limitations. Check details here
If you have any questions regarding licensing - please contact us. [email protected]

