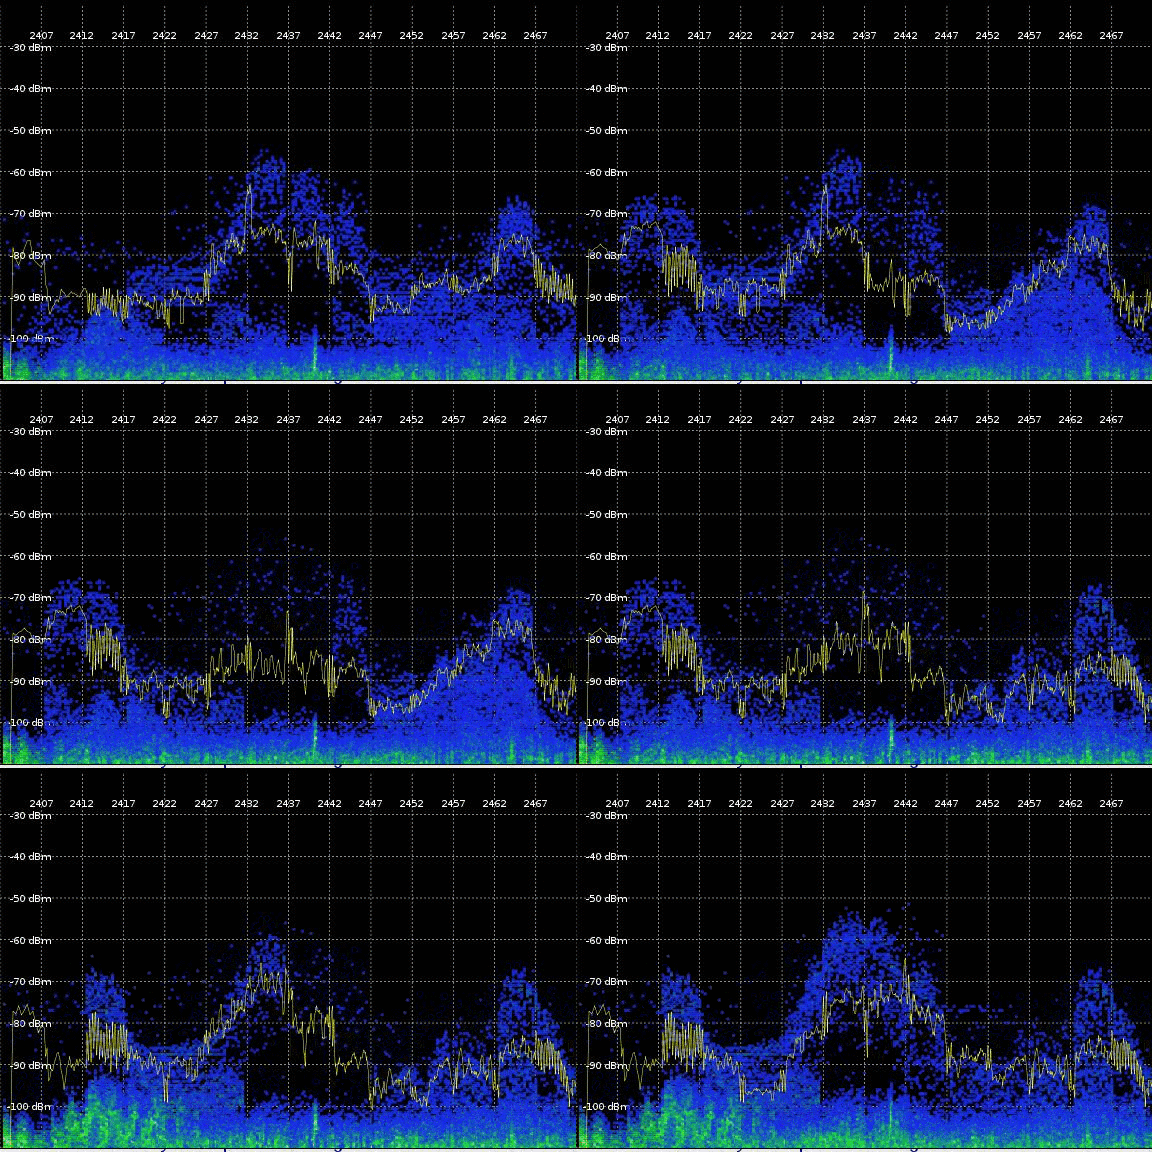
This is a simple spectrum visualizer and dumper based on the ath9k spectral scan feature. If you have a Qualcomm/Atheros Wifi device on Linux, and have built the driver with debugfs support, you can use this program to see the RF spectrum in something resembling real-time.
- one or more Wifi devices that supports the spectral scan feature (only ath9k and ath9k_htc drivers tested at this point)
- above drivers compiled with debugfs enabled
- the iw utility installed
On Ubuntu, run:
$ sudo python speccy.py wlan0 wlan1 ...
where wlanN are the devices you'd like to use. Up to four devices are supported.
- 'l' - Toggle line graph
- 'f' - Cycle through frequency bands
- 's' - Toggle scatter plot
- '1', '2', '3', '4' - Switch control to device number n. Default is 1
- 'c' - Switch scanner to 'chanscan' mode [default]. Hardware tunes to all WiFi channels and deliver a certain number of samples per channel. Default is 8
- 'Arrow key Up' - Double the number of samples (up to 255)
- 'Arrow key Down' - Divide the number of samples by two (down to 1)
- 'b' - Switch scanner to 'background' mode. Hardware will deliver as much samples as possible
- 'Arrow key Left' - Tune one channel up (only in 'background' mode)
- 'Arrow key Right' - Tune one channel up (only in 'background' mode)
- 'Arrow key Up' - Increase the number of samples hold for visualization
- 'Arrow key Down' - Decrease the number of samples hold for visualization
- 'm' - Toggle between HT20 [default] and HT40 mode
- 'd' - Toggle dumping binary data with timestamp in a file
- 'u' - Toggle UI processing
- 'q' - Quit the program
