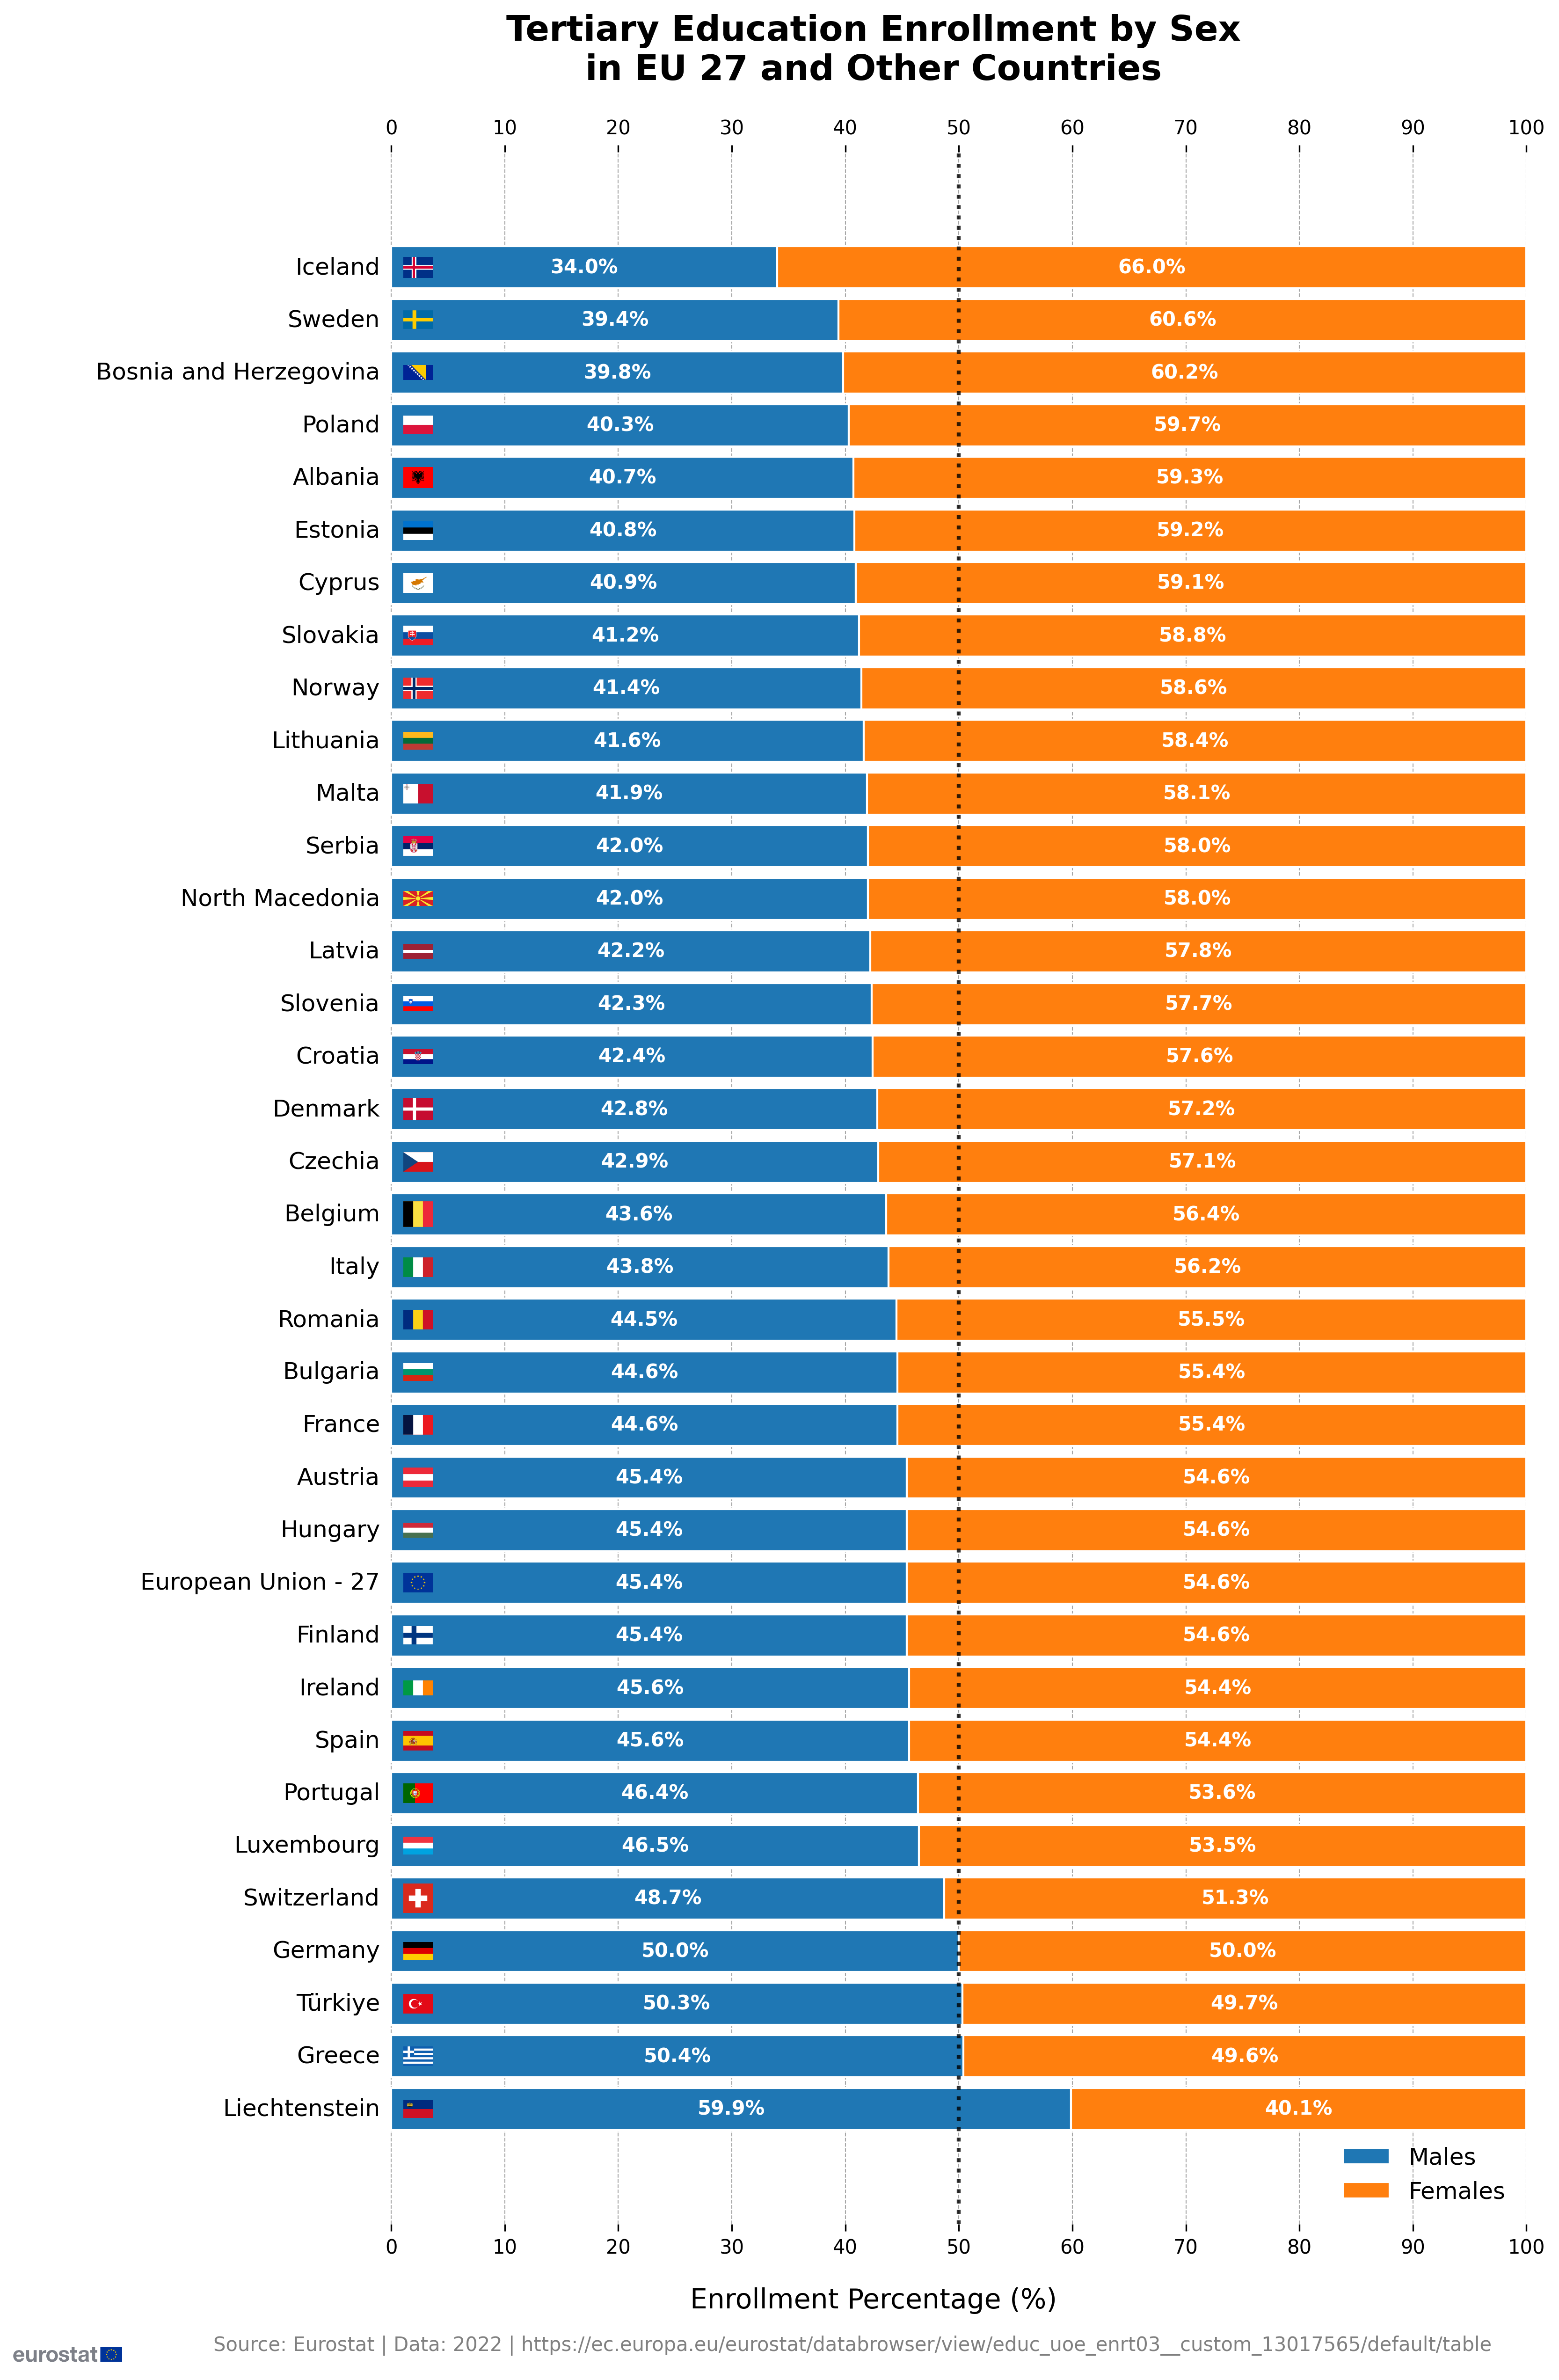
This project visualizes tertiary education enrollment percentages by gender (male vs. female) across the EU 27 countries and other European nations using data from Eurostat (2022).
The visualization highlights differences in male and female participation in tertiary education across various countries, making the 50% mark clearly visible for comparison.
- Data is sourced from Eurostat, 2022.
- The dataset can be found here.
- Note: The latest data (2022) is missing for the Netherlands, the UK, and Montenegro.
- Python with the Matplotlib library for creating the visualization.
- Visual Studio Code (VS Code) for development.
- Country Flags: The country flags used in the visualization are from the Hampus Borgos Country Flags repository.
- Male and female enrollment percentages are displayed for each country.
- The graph is sorted by female enrollment in ascending order.
- The 50% enrollment mark is clearly highlighted with a dotted line for easier comparison between genders.
- The visualization includes country flags and labels.
Here is the visualization of the tertiary education enrollment by gender:
- Install Python: Ensure that Python 3 is installed on your system.
- Install Matplotlib: Install Matplotlib via
pipby running:pip install matplotlib
- Run the Script: Use the command below to run the Python script that generates the visualization:
python your_script_name.py
Contributions to improve the visualization or extend its functionality are welcome. Please feel free to submit pull requests.
This project is licensed under the MIT License.
