| Student's name | SCIPER |
|---|---|
| Adriana Orellana | 376792 |
| Angel Zenteno | 376890 |
| Jianan Xu | 370489 |
Milestone 1 • Milestone 2 • Milestone 3
10% of the final grade
This is a preliminary milestone to let you set up goals for your final project and assess the feasibility of your ideas. Please, fill the following sections about your project.
(max. 2000 characters per section)
Find a dataset (or multiple) that you will explore. Assess the quality of the data it contains and how much preprocessing / data-cleaning it will require before tackling visualization. We recommend using a standard dataset as this course is not about scraping nor data processing.
Hint: some good pointers for finding quality publicly available datasets (Google dataset search, Kaggle, OpenSwissData, SNAP and FiveThirtyEight), you could use also the DataSets proposed by the ENAC (see the Announcements section on Zulip).
Our dataset was obtained from the IUCN Red List, focusing on animals classified under various conservation statuses: Extinct (EX), Critically Endangered (CR), Endangered (EN), Vulnerable (VU), and Near Threatened (NT). The original dataset, provided in CSV format, contained 25,183 entries, each detailing 20 attributes. To augment our data, we developed a script to scrap additional information through the IUCN Red List API, aiming for a detailed representation of conservation-challenged animals. The resulting dataset was organized into a directory with 1,799 subfolders, each representing an individual animal and containing six JSON files with additional attributes.
Initially, we identified that every animal has a unique ID. However, the initial CSV dataset faced two significant challenges: (1) the duplication of some animal entries and (2) the presence of numerous empty fields, a consequence of the limited information available on these conservation-challenged animals To transform our dataset into a valuable resource for visualization, we preprocessed and cleaned it. First, we merged the CSV and scraped data, then carefully eliminated duplicate animal entries and attributes with null values to ensure data integrity.
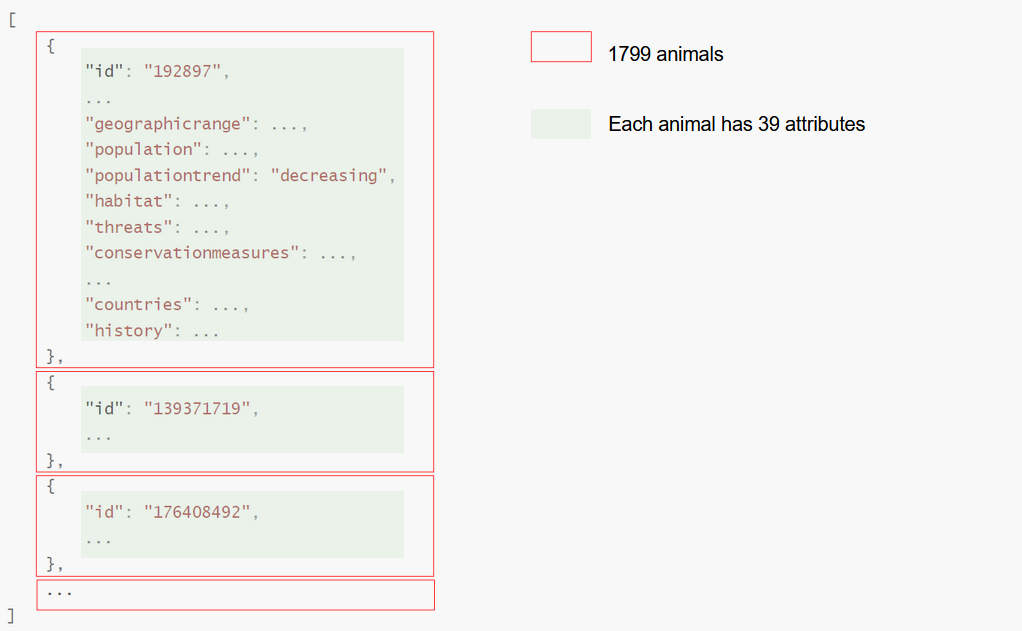
Through this process, we transformed our dataset into JSON format, incorporating 1,799 animals with 39 attributes. Below is an example illustrating how our dataset is formatted:
The final format ensures our dataset is ready for analysis and fits our project needs, as it organizes the data in a structured manner that is easily accessible for further interpretation.
You can access the final dataset at ./data_viz_animals/animals.json, while the raw data extracted from IUCN Red List API can be found within ./data_viz_animals/raw_data/ and the preprocessed csv originally provided by IUCN Red List is located at ./data_viz_animals/species.csv
Frame the general topic of your visualization and the main axis that you want to develop.
- What am I trying to show with my visualization?
- Think of an overview for the project, your motivation, and the target audience.
General Topic and Main Axis Development
Every year, approximately between 1,000 and 30,000 species face extinction [1], raising a critical question: Will humans become the only inhabitants of Earth after several centuries? This pressing concern underscores the urgency for immediate conservation actions. The foundation of effective animal protection lies in enhancing public awareness and consensus, with data serving as a tool for this purpose. Visualization acts as the conduit, bridging the gap between data and public perception.
Overview, Motivation, and Target Audience
Our project aims to create a dynamic and informative webpage targeted primarily at students, fostering increased awareness about conservation-challenged animals. This initiative is driven by the belief that education and engagement can spark collective action towards animal conservation.
Visualization Content and Features
For the visual part of our project, we intend to incorporate several features designed to raise awareness about endangered animals:
- 3D Navigable Globe: A visualization showcasing the global distribution of conservation-challenged animals, offering users a comprehensive understanding of their spread and hotspots.
- Animals Profiles: Detailed profiles for each animal, including information on appearance, population, habitats, threats, and conservation measures.
- Educational Content: Curated educational videos that highlight the importance of conservation efforts and inspire viewers to contribute to these causes.
- Interactive Feature: We plan to integrate the following interactive element to further engage users:
- EcoSurvival Game: A game where participants match conservation-challenged animals with their ideal ecological requirements, encompassing food, habitats, and more. High scorers will be awarded a certificate of achievement, fostering learning through engaging gameplay.
Pre-processing of the data set you chose
- Show some basic statistics and get insights about the data
Besides dataset pre-processing and cleaning mentioned in the Dataset section, we conducted exploratory data analysis. The details of pre-processing, cleaning, and EDA can be seen in EDA.ipynb. We present basic statistics as follows:
- The number of animals in each conservation status, where categories represent:
- NT: Near Threatened
- VU: Vulnerable
- EN: Endangered
- CR: Critically Endangered
- EW: Extinct in the Wild
- EX: Extinct
This table helps us understand how urgently we need to work to conserve different species:
| category | counts | |
|---|---|---|
| 0 | EN | 579 |
| 1 | VU | 502 |
| 2 | NT | 410 |
| 3 | CR | 298 |
| 4 | EX | 9 |
- The number of animals per habitat, where an animal can have more than one habitat:
| habitat | counts | |
|---|---|---|
| 0 | Wetlands (inland) - Permanent Rivers/Streams/C... | 1033 |
| 1 | Forest - Subtropical/Tropical Moist Lowland | 389 |
| 2 | Wetlands (inland) - Permanent Freshwater Lakes... | 254 |
| 3 | Forest - Subtropical/Tropical Moist Montane | 193 |
| 4 | Marine Deep Benthic - Deep Sea Vents (Rifts/Se... | 159 |
| 5 | Wetlands (inland) - Permanent Freshwater Marsh... | 131 |
| 6 | Wetlands (inland) - Bogs, Marshes, Swamps, Fen... | 109 |
| 7 | Wetlands (inland) - Freshwater Springs and Oases | 100 |
| 8 | Forest - Subtropical/Tropical Swamp | 91 |
| 9 | Wetlands (inland) - Seasonal/Intermittent/Irre... | 86 |
| 10 | Wetlands (inland) - Seasonal/Intermittent Fres... | 68 |
| 11 | Forest - Temperate | 59 |
| 12 | Rocky areas (eg. inland cliffs, mountain peaks) | 40 |
| 13 | Forest - Subtropical/Tropical Dry | 32 |
| 14 | Grassland - Subtropical/Tropical High Altitude | 31 |
| 15 | Savanna - Dry | 27 |
| 16 | Wetlands (inland) - Seasonal/Intermittent Fres... | 27 |
| 17 | Grassland - Temperate | 26 |
| 18 | Shrubland - Temperate | 23 |
| 19 | Shrubland - Mediterranean-type Shrubby Vegetation | 21 |
-
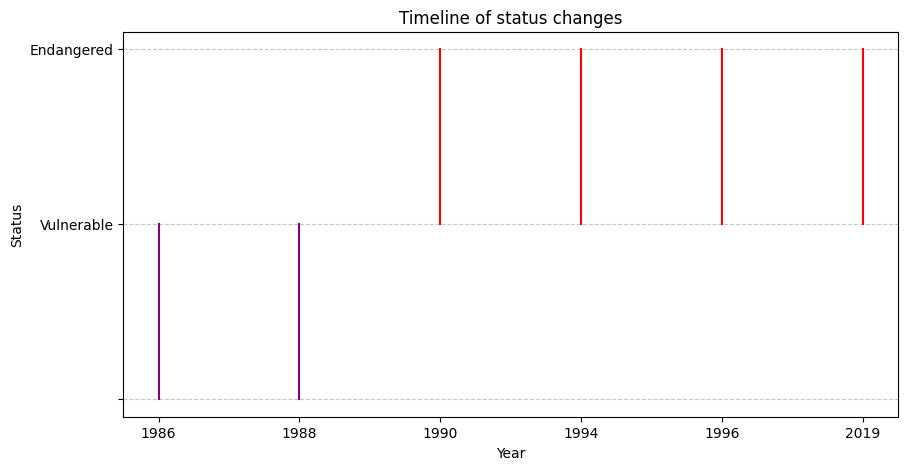
Progress of an animal's status over time: Using Herichthys labridens in Mexico as an example, we track the progress of an animal's conservation status over time.
- Main threats to animals: This table outlines the top 20 threats that endangered animals face, highlighting problems that must be addressed to ensure their survival.
| threat | counts | |
|---|---|---|
| 0 | Annual & perennial non-timber crops | 819 |
| 1 | Agricultural & forestry effluents | 659 |
| 2 | Dams & water management/use | 634 |
| 3 | Mining & quarrying | 562 |
| 4 | Logging & wood harvesting | 535 |
| 5 | Scale Unknown/Unrecorded | 427 |
| 6 | Agro-industry farming | 409 |
| 7 | Domestic & urban waste water | 391 |
| 8 | Livestock farming & ranching | 371 |
| 9 | Type Unknown/Unrecorded | 333 |
| 10 | Housing & urban areas | 321 |
| 11 | Small-holder farming | 310 |
| 12 | Soil erosion, sedimentation | 296 |
| 13 | Herbicides and pesticides | 270 |
| 14 | Unintentional effects: (subsistence/small scal... | 261 |
| 15 | Industrial & military effluents | 256 |
| 16 | Sewage | 244 |
| 17 | Fishing & harvesting aquatic resources | 227 |
| 18 | Nutrient loads | 227 |
| 19 | Unintentional effects: (large scale) [harvest] | 224 |
- What others have already done with the data?
- Why is your approach original?
- What source of inspiration do you take? Visualizations that you found on other websites or magazines (might be unrelated to your data).
- In case you are using a dataset that you have already explored in another context (ML or ADA course, semester project...), you are required to share the report of that work to outline the differences with the submission for this class.
Originality
Our approach changes the way conservation-challenged animal data is presented by shifting from the traditional, static encyclopedic format to an engaging, dynamic user experience. We introduce a 3D navigable globe that embeds animal profiles, allowing users to explore species by region, inviting users to engage deeply with the content. Additionally, we innovate by integrating gamification through features like the EcoSurvival game. These elements are designed not just for engagement but to spur users into conservation actions, a significant leap beyond the informational offerings of most sites. Our originality lies in these interactive and educational enhancements, drawing on diverse inspirations to make environmental awareness both informative and enjoyable.
Source of Inspiration
After extensive brainstorming and reviewing some relevant websites, we've identified several sources (shown below) from which we're considering drawing inspiration. With preliminary approval from the websits' owners and our professors, we MAY adapt some of their innovative ideas to our project.
Species in Pieces, react-globe.gl, Animalia
[1] Sisk, T. D., Launer, A. E., Switky, K. R., & Ehrlich, P. R. (1994). Identifying extinction threats. BioScience, 44(9), 592-604.
10% of the final grade
You can find our website at the following link: website and our report for this milestone.
80% of the final grade
As we have deployed our website, so you don't need any additional technical setup, you can get access to our website, screencast, and process book by following links:
- < 24h: 80% of the grade for the milestone
- < 48h: 70% of the grade for the milestone


