-
Notifications
You must be signed in to change notification settings - Fork 498
Alibaba Dragonwell8 User Guide
Over the years, more than a billion lines of Java code have been written in Alibaba. While adopting OpenJDK to run these applications, we have found a need to customize it specifically for large-scale Java application deployments. Our customization has been well tested in our environment. We are now contributing some of our work into the Java community.
Alibaba Dragonwell, as a downstream version of OpenJDK, is the in-house OpenJDK implementation at Alibaba. It is optimized for online e-commerce, financial and logistics applications running on 100,000+ servers. Alibaba Dragonwell is the engine that runs these distributed Java applications in extreme scaling.
Alibaba Dragonwell is a "friendly fork" under the same licensing terms as the upstream OpenJDK project. Alibaba is committed to collaborate closely with the OpenJDK community. We intend to bring as many customized features as possible from Alibaba Dragonwell to the upstream.
Alibaba Dragonwell JDK currently supports Linux/x86_64 platform only.
Two options to install Alibaba Dragonwell are described below.
- Option 1: Download and install pre-built Alibaba Dragonwell
- You may download a pre-built Alibaba Dragonwell JDK from its GitHub page: https://github.com/alibaba/dragonwell8/releases
- Uncompress the package to the installation directory.
- Option 2, Install via YUM
Alibaba Dragonwell is officially supported and maintained in Alibaba Cloud Linux 2 (Aliyun Linux 2) YUM repository, and this repo should be also compatible with Aliyun Linux 17.1, Red Hat Enterprise Linux 7 and CentOS 7.
- For users running Alibaba Cloud Linux 2 OS, you should be able to install Alibaba Dragonwell by simply running:
sudo yum install -y java-1.8.0-alibaba-dragonwell; - For users running with aforementioned compatible distros, place a new repository file under
/etc/yum.repos.d(e.g.:/etc/repos.d/alinux-plus.repo) with contents as follows, then you should be able to install Alibaba Dragonwell by executing:sudo yum install -y java-1.8.0-alibaba-dragonwell:
# plus packages provided by Aliyun Linux dev team
[plus]
name=AliYun-2.1903 - Plus - mirrors.aliyun.com
baseurl=http://mirrors.aliyun.com/alinux/2.1903/plus/$basearch/
gpgcheck=1
gpgkey=http://mirrors.aliyun.com/alinux/RPM-GPG-KEY-ALIYUN
To enable Alibaba Dragonwell JDK for your application, simply set JAVA_HOME to point to the installation directory of Alibaba Dragonwell.
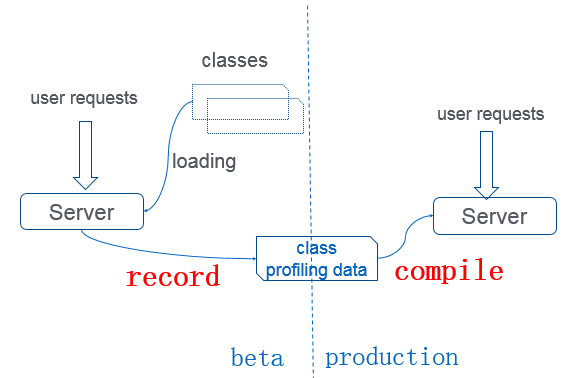
The rationale in JWarmup is to record profiling data in a "previous run" including hot compiled methods, ordering of class initialization, etc. In a later "normal run", the JVM would eagerly load and resolve these classes based on the recorded profiling data, and proactively use C2 to compile the related methods.

The typical usage is showed as above:
- In beta stage, the profiling data is recorded and stored into a file on disk with the generated loads.
- In production stage, JVM proactively loads, resolves related classes and compiles the hot methods
- In beta stage, use the JVM options as below (assuming CMS is used):
-XX:-ClassUnloading -XX:-CMSClassUnloadingEnabled -XX:-ClassUnloadingWithConcurrentMark -XX:CompilationWarmUpLogfile=jwarmup.log -XX:+CompilationWarmUpRecording -XX:CompilationWarmUpRecordTime=300
Caveats: The recording model does not support class unloading for now.
- In production stage, use the JVM options as below:
-XX:+CompilationWarmUp -XX:-TieredCompilation -XX:CompilationWarmUpLogfile=jwarmup.log -XX:CompilationWarmUpDeoptTime=0
Caveats: The warmup model does not support tiered compilation for now.
Caveats: JWarmUp will deoptimize all warmup compilation methods after given time. Disable it by setting CompilationWarmUpDeoptTime to 0.
- Trigger compilation at appropriate time
after all necessary initialization work of your application is done, call the following API to notify JVM:
com.alibaba.jwarmup.JWarmUp.notifyApplicationStartUpIsDone()After that, the methods will be compiled by JVM proactively.
Note: EnableJFR was marked as obsolete in 8.4.4 and removed in 8.5.5, please do not use this parameter when using 8.5.5 or later.
Java Flight Recorder (JFR) is a tool to collect diagnostic and profiling data for Java applications. It is closely integrated into JVM and its performance overhead is minimal. The overhead is negligible if the default JFR config (-XX:+EnableJFR) is enabled.
In Alibaba Dragonwell, an option called "EnableJFR" is used to enable/disable the JFR feature. It's disabled by default. To enable JFR, you may start java with "-XX:+EnableJFR". For example:
java -XX:+EnableJFR -XX:StartFlightRecording=duration=1m,filename=rec.jfr MyApp
When running the JTreg test, please add the extra option -vmoption:-XX:+EnableJFR. Otherwise the test case will not run correctly. Here is an example of running JFR JTreg test:
make test JTREG_TEST_EXTRA_OPTIONS=-vmoption:-XX:+EnableJFR TEST=jdk_jfr
Java Mission Control (JMC) is the GUI to analyze JFR results. Please use JMC version 7.0 or later version to open the JFR record file. Currently, you can not use JMC to control JFR. But it will be supported in the future. More details on JFR and JMC are available on the Oracle website.
G1ElasticHeap is a GC feature to return memory of Java heap to OS to reduce the memory footprint of Java process. To enable this feature, you need to use G1 GC by options: -XX:+UseG1GC -XX:+G1ElasticHeap.
There are 3 modes which can be enabled in G1ElasticHeap.
Memory will be uncommitted by periodic GC. To enable periodic uncommit, use option -XX:+ElasticHeapPeriodicUncommit or dynamically enable the option via jinfo:
jinfo -flag +ElasticHeapPeriodicUncommit PID
Related options:
ElasticHeapPeriodicYGCIntervalMillis, 15000
(target young GC interval 15 seconds in default)
(eg, if Java runs with MaxNewSize=4g, young GC every 30 seconds, G1ElasticHeap will keep 15s GC interval and make a max 2g young generation to uncommit 2g memory)
ElasticHeapPeriodicInitialMarkIntervalMillis, 3600000
(Target initial mark interval, 1 hour in default. Unused memory of old generation will be uncommitted after last mixed GC.)
ElasticHeapPeriodicUncommitStartupDelay, 300
(Delay after startup to do memory uncommit, 300 seconds in default)
ElasticHeapPeriodicMinYoungCommitPercent, 50
(Percentage of young generation to keep, default 50% of the young generation will not be uncommitted)
To limit the young/old generation separately. Use jcmd or MXBean to enable. Example:
jcmd PID GC.elastic_heap young_commit_percent=40 uncommit_ihop=40
young_commit_percent: percentage of young generation(MaxNewSize) to keep, rest of young generation will be uncommitted
uncommit_ihop: Percentage to trigger G1 concurrent cycle and mixed GC (like InitiatingHeapOccupancyPercent). Unused memory of old generation will be uncommitted after last mixed GC.
Use MXBean:
MBeanServer server = ManagementFactory.getPlatformMBeanServer();
ElasticHeapMXBean elasticHeapMXBean = ManagementFactory.newPlatformMXBeanProxy(server,
                                                     "com.alibaba.management:type=ElasticHeap",
                                                      ElasticHeapMXBean.class);
elasticHeapMXBean.setYoungGenCommitPercent(40);
elasticHeapMXBean.setUncommitIHOP(40);
Dynamically to limit the heap as a percentage of origin Xmx.
Use jcmd:
jcmd PID GC.elastic_heap softmx_percent=60
Use MXBean:
elasticHeapMXBean.setSoftmxPercent(70);
ElasticHeapMinYoungCommitPercent, 10
(Mininum percentage of young generation)
ElasticHeapYGCIntervalMinMillis, 5000
(Mininum young GC interval)
ElasticHeapInitialMarkIntervalMinMillis, 60000
(Mininum initial mark interval)
ElasticHeapEagerMixedGCIntervalMillis, 15000
(Guaranteed mixed GC interval, to make sure the mixed will happen in time to uncommit memory after last mixed GC)
ElasticHeapOldGenReservePercent, 5
(To keep a mininum percentage of Xmx for old generation in the uncommitment after last mixed GC)
ElasticHeapPeriodicYGCIntervalCeilingPercent, 25
ElasticHeapPeriodicYGCIntervalFloorPercent, 25
(The actual young GC interval will fluctuate between
ElasticHeapPeriodicYGCIntervalMillis * (100 - ElasticHeapPeriodicYGCIntervalFloorPercent) / 100 and
ElasticHeapPeriodicYGCIntervalMillis * (100 + ElasticHeapPeriodicYGCIntervalCeilingPercent) / 100 )
-
Mini-Heapdump support With Alibaba Dragonwell you may dump partial Java heap by omitting the content of all primitive type arrays. A new option
miniis added to the sub-command-dumpofjmaptool. An example:jmap -dump:live,mini,format=b,file=heap121.bin <PID> -
PrintYoungGenHistoAfterParNewGC The flag will print the histogram of the young generation after a ParNew GC. It is supported in jinfo :
jinfo -flag +PrintYoungGenHistoAfterParNewGC <PID> -
-XX:+PrintGCRootsTraceTimeThe flag will print the details of the ParNew GC phase. It helps user to find the problem of long GC pause time. This flag could be enabled byjinfo:
jinfo -flag +PrintGCRootsTraceTime <pid> // turn on the flag
jinfo -flag -PrintGCRootsTraceTime <pid> // turn off the flag
-
Fixed incorrect metaspace usage after full GC Metaspace usage in the GC log are not correctly updated after a full GC. This issue has been fixed in Alibaba Dragonwell.
-
-XX:ArrayAllocationWarningSize= The flag will print the calling stack of an array allocation if the allocation size is greater than the ArrayAllocationWarningSize. The default value is 512M, this flag could be enabled by jinfo:
// print the allocation stack if more than 1M array allocated.
jinfo -flag ArrayAllocationWarningSize=1048576 <pid>
// back to default value(512M)
jinfo -flag ArrayAllocationWarningSize=536870912 <pid>
Use -XX:FlightRecorderOptions=sampleobjectallocations=true to enable this feature, which allows to sample object allocation happened in C2 compiler. Users can use -XX:FlightRecorderOptions=sampleobjectallocations=true,objectallocationssamplinginterval=512 to set the sampling interval, the default value is 1024. Follow below steps to use this feature:
- Use
jcmd <pid> JFR.start settings=ObjectProfiling.jfc name=MyRecordingto start a JFR recording, the following configurations need to be set in ObjectProfiling.jfc:
<?xml version="1.0" encoding="UTF-8"?>
<configuration version="2.0">
  <event name="com.oracle.jdk.OptoInstanceObjectAllocation">
    <setting name="enabled">true</setting>
  </event>
  <event name="com.oracle.jdk.OptoArrayObjectAllocation">
    <setting name="enabled">true</setting>
  </event>
</configuration>
- Use
jcmd <pid> JFR.stop name=MyRecording filename=dump.jfrto generate JFR dump file.
Users can use JMC to parse the JFR dump file and analyze the hot path of objects allocation. We did the following enhancements in JMC:
Add object profiling tab, used to identify the hot objects frequently allocated in C2 compiler:

Enhance the flame graph view to support aggregating the allocation thread stacks by allocation size:

How to open flame view:
1.Go to Window | Show View | Other...
2.Select Mission Control / Flame View
Metaspace Dump can get a snapshot of JVM Metaspace. Currently, it supports text output format and is mainly used to troubleshoot FGC problems caused by Metaspace. This feature is similar to Heap Dump.
How to use (please make sure that the target JVM process is using Alibaba Dragonwell JDK) :
$ jcmd <pid> Metaspace.dump filename=<direcotry or file name>The following JVM options are provided:
-
-XX:+MetaspaceDumpBeforeFullGC: Trigger a dump before Full GC. The default is off. -
-XX:+MetaspaceDumpAfterFullGC: Trigger a dump after Full GC. The default is off. -
-XX+MetaspaceDumpOnOutOfMemoryError:Trigger a dump when oom. The default is off. -
-XX:MetaspaceDumpPath=<path>:Specify the path (file name or directory) of Metaspace Dump output. The default is java_pid.mprof under the process working directory.
The above JVM options can be dynamically changed by jinfo.
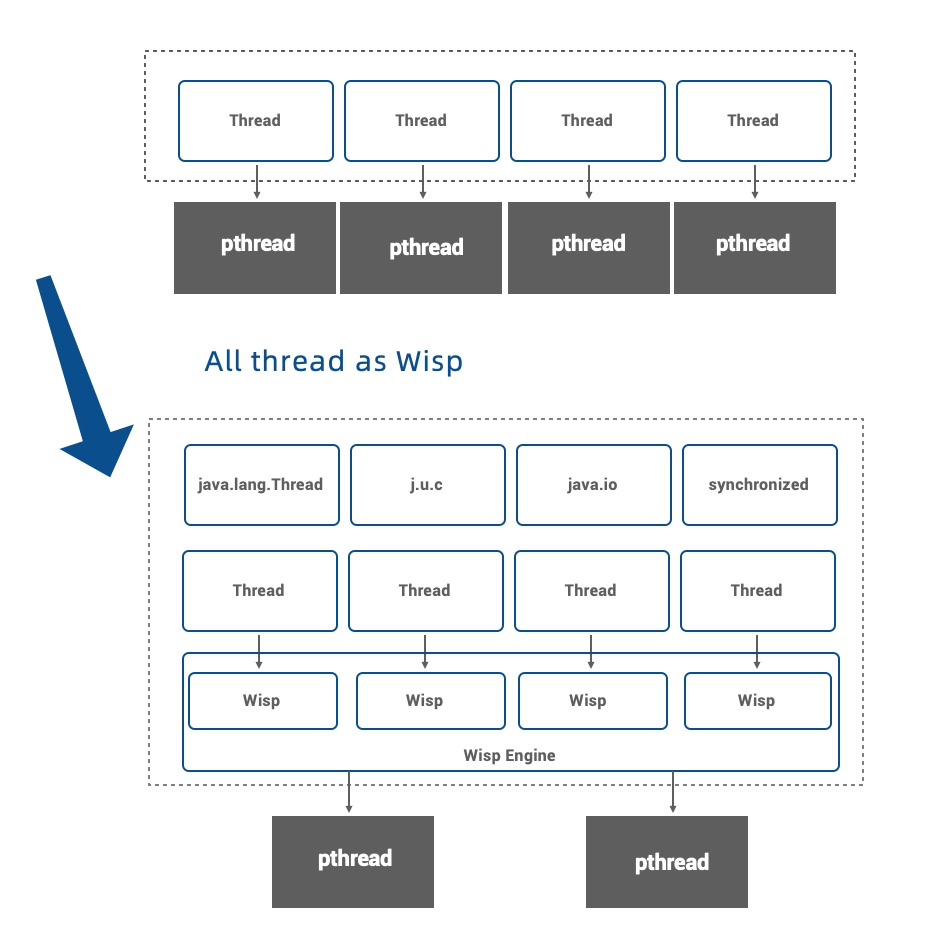
Wisp provides a user-mode thread implementation on the JVM. When Wisp2 feature is turned on, Java threads are no longer simply mapped to kernel-level threads but correspond to a coroutine. The JVM schedules a large number of coroutines on a small number of core lines to reduce the scheduling overhead of the kernel and improve the performance of the webserver. For more technical details, see Wisp documentation.

Just add JVM parameters to starting the use of Wisp2. Let's introduce a simple test:
public class Sleep {
    public static void main(String[] args) {
        for (int i = 0; i < 1000; i++) {
            new Thread(() -> {
                try {
                    Thread.sleep(1000);
                } catch (InterruptedException e) { /* pass */}
            }).start();
        }
    }
}
$ javac Sleep.java
$ java -XX:+UnlockExperimentalVMOptions -XX:+UseWisp2 Sleep &
$ jstack $! | grep -A1 -- '- Coroutine' - Coroutine [0x7f6d6d60fb20] "Thread-978" #1076 active=1 steal=0 steal_fail=0 preempt=0 park=0/-1
at java.dyn.CoroutineSupport.unsafeSymmetricYieldTo(CoroutineSupport.java:138)
--
- Coroutine [0x7f6d6d60f880] "Thread-912" #1009 active=1 steal=0 steal_fail=0 preempt=0 park=0/-1
at java.dyn.CoroutineSupport.unsafeSymmetricYieldTo(CoroutineSupport.java:138)
...
We can see that the method on the top frame is the coroutine switch because the thread calls sleep and yielding the execution flow.
For more information, please check the Wisp documentation.
Please take a look at Alibaba Dragonwell FAQ for support. Or send mail to [email protected] for more help. Or you may enter the group chat code below with DingTalk to join the group chat. DingDing 35434688
Alibaba Dragonwell