"What do we want? Climate Justice! When do we want it? Now!" - FFF
Warning
This library is a work in progress! Breaking changes should be expected until a 1.0 release, so version pinning is recommended.
Welcome to Wetterdienst, your friendly weather service library for Python.
We are a group of like-minded people trying to make access to weather data in Python feel like a warm summer breeze,
similar to other projects like rdwd for the R language, which originally drew our
interest in this project. Our long-term goal is to provide access to multiple weather services as well as other related
agencies such as river measurements. With wetterdienst we try to use modern Python technologies all over the place.
The library is based on polars (we <3 pandas, it is still part of
some IO processes) across the board, uses uv for package administration and GitHub
Actions for all things CI. Our users are an important part of the development as we are not currently using the data we
are providing and only implement what we think would be the best. Therefore, contributions and feedback whether it be
data related or library related are very welcome! Just hand in a PR or Issue if you think we should include a new
feature or data source.
For an overview of the data we have currently made available and under which license it is published take a look at the data section. Detailed information on datasets and parameters is given at the coverage subsection. Licenses and usage requirements may differ for each provider so check this out before including the data in your project to be sure that you fulfill copyright requirements!
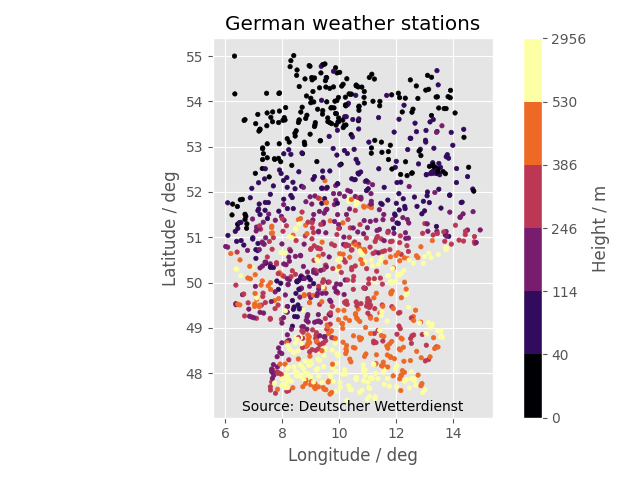
For a closer look on the DWD data, you can use the interactive map
or the table provided by the rdwd package.
- APIs for stations and values
- Get stations nearby a selected location
- Define your request by arguments such as
parameters,periods,start date,end date - Define general settings in Settings context
- Command line interfaced
- Web-API via FastAPI, hosted on wetterdienst.eobs.org
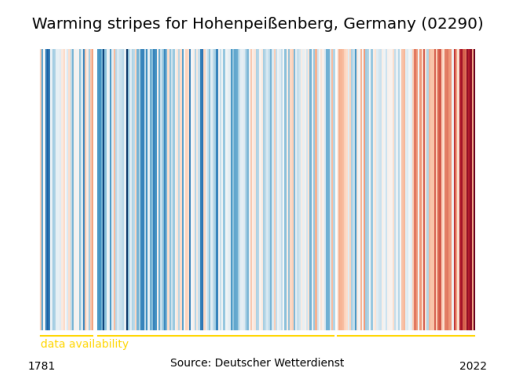
- Rich UI features like explorer, stripes
- Run SQL queries on the results
- Export results to databases and other data sinks
- Public Docker image
- Interpolation and Summary of station values
Via PyPi (standard):
pip install wetterdienstVia Github (most recent):
pip install git+https://github.com/earthobservations/wetterdienstThere are some extras available for wetterdienst. Use them like:
pip install wetterdienst[sql]- cratedb: Install support for CrateDB.
- docs: Install the Sphinx documentation generator.
- duckdb: Install support for DuckDB.
- export: Install openpyxl for Excel export and pyarrow for writing files in Feather- and Parquet-format.
- influxdb: Install support for InfluxDB.
- interpolation: Install support for station interpolation.
- mysql: Install support for MySQL.
- matplotlib: Install support for plotting (matplotlib), only used in radar examples.
- plotting: Install support for plotting (plotly).
- postgresql: Install support for PostgreSQL.
- sql: Install DuckDB for querying data using SQL.
To check the installation, invoke:
wetterdienst --helpDocker images for each stable release will get pushed to GitHub Container Registry.
wetterdienst serves a full environment, including all the optional dependencies of Wetterdienst.
Pull the Docker image:
docker pull ghcr.io/earthobservations/wetterdienstUse the latest stable version of wetterdienst:
$ docker run -ti ghcr.io/earthobservations/wetterdienst
Python 3.8.5 (default, Sep 10 2020, 16:58:22)
[GCC 8.3.0] on linux
import wetterdienst
wetterdienst.__version__The wetterdienst command is also available:
# Make an alias to use it conveniently from your shell.
alias wetterdienst='docker run -ti ghcr.io/earthobservations/wetterdienst wetterdienst'

wetterdienst --help
wetterdienst --version
wetterdienst infoRunning wetterdienst on Raspberry Pi, you need to install numpy and lxml prior to installing wetterdienst by running the following lines:
# not all installations may be required to get lxml running
sudo apt-get install gfortran
sudo apt-get install libopenblas-base
sudo apt-get install libopenblas-dev
sudo apt-get install libatlas-base-dev
sudo apt-get install python3-lxml
Additionally expanding the Swap to 2048 mb may be required and can be done via swap-file:
sudo nano /etc/dphys-swapfileThanks chr-sto for reporting back to us!
Get historical climate summary for two German stations between 1990 and 2020
from wetterdienst import Settings
from wetterdienst.provider.dwd.observation import DwdObservationRequest

settings = Settings(  # default
  ts_shape="long",  # tidy data
  ts_humanize=True,  # humanized parameters
  ts_convert_units=True  # convert values to SI units
)

request = DwdObservationRequest(
  parameters=[
    ("daily", "climate_summary", "precipitation_height"),
  ],
  start_date="2002-08-11",  # if not given timezone defaulted to UTC
  end_date="2002-08-13",  # if not given timezone defaulted to UTC
  settings=settings
).filter_by_station_id(station_id=(5779,))

stations = request.df
stations.head()
# ┌────────────┬──────────────┬──────────────┬──────────┬───────────┬────────┬─────────────┬─────────┐
# │ station_id ┆ start_date   ┆ end_date     ┆ latitude ┆ longitude ┆ height ┆ name        ┆ state   │
# │ ---        ┆ ---          ┆ ---          ┆ ---      ┆ ---       ┆ ---    ┆ ---         ┆ ---     │
# │ str        ┆ datetime[μs, ┆ datetime[μs, ┆ f64      ┆ f64       ┆ f64    ┆ str         ┆ str     │
# │            ┆ UTC]         ┆ UTC]         ┆          ┆           ┆        ┆             ┆         │
# ╞════════════╪══════════════╪══════════════╪══════════╪═══════════╪════════╪═════════════╪═════════╡
# │ 05779      ┆ 1971-01-01   ┆ ...          ┆ 50.7313  ┆ 13.7516   ┆ 877.0  ┆ Zinnwald-Ge ┆ Sachsen │
# │            ┆ 00:00:00 UTC ┆ 00:00:00 UTC ┆          ┆           ┆        ┆ orgenfeld   ┆         │
# └────────────┴──────────────┴──────────────┴──────────┴───────────┴────────┴─────────────┴─────────┘

values = request.values.all().df
values.head()
# ┌────────────┬─────────────────┬──────────────────────┬─────────────────────────┬───────┬─────────┐
# │ station_id ┆ dataset         ┆ parameter            ┆ date                    ┆ value ┆ quality │
# │ ---        ┆ ---             ┆ ---                  ┆ ---                     ┆ ---   ┆ ---     │
# │ str        ┆ str             ┆ str                  ┆ datetime[μs, UTC]       ┆ f64   ┆ f64     │
# ╞════════════╪═════════════════╪══════════════════════╪═════════════════════════╪═══════╪═════════╡
# │ 05779      ┆ climate_summary ┆ precipitation_height ┆ 2002-08-11 00:00:00 UTC ┆ 67.9  ┆ 10.0    │
# │ 05779      ┆ climate_summary ┆ precipitation_height ┆ 2002-08-12 00:00:00 UTC ┆ 312.0 ┆ 10.0    │
# │ 05779      ┆ climate_summary ┆ precipitation_height ┆ 2002-08-13 00:00:00 UTC ┆ 26.3  ┆ 10.0    │
# └────────────┴─────────────────┴──────────────────────┴─────────────────────────┴───────┴─────────┘

# to get a pandas DataFrame and e.g. create some matplotlib plots
values.to_pandas()# Get list of all stations for daily climate summary data in JSON format
wetterdienst stations --provider=dwd --network=observation --parameters=daily/kl --all
# Get daily climate summary data for specific stations
wetterdienst values --provider=dwd --network=observation --parameters=daily/kl --station=1048,4411Checkout examples for more examples.
We want to acknowledge all environmental agencies which provide their data open and free of charge first and foremost for the sake of endless research possibilities.
We want to acknowledge all contributors for being part of the improvements to this library that make it better and better every day.
-
Restapi: https://wetterdienst.eobs.org/
-
Explorer: https://wetterdienst.streamlit.app/
-
Stripes: https://stripes.streamlit.app/
-
Documentation: https://wetterdienst.readthedocs.io/
-
Examples (runnable scripts): https://github.com/earthobservations/wetterdienst/tree/main/examples
-
Benchmarks: https://github.com/earthobservations/wetterdienst/tree/main/benchmarks
Special thanks to the kind people at JetBrains s.r.o. for supporting us with excellent development tooling.


