-
Notifications
You must be signed in to change notification settings - Fork 77
perf.md
Hongkai Liu edited this page Jun 2, 2016
·
14 revisions
$ nproc
4
$ cat /proc/meminfo
MemTotal:        8011216 kB
$ uname -m
x86_64
$ cat /etc/*-release
CentOS Linux release 7.2.1511 (Core) apache-tomcat-7.0.69/conf/server.xml
<Connector port="8080" maxThreads="1500" protocol="org.apache.coyote.http11.Http11NioProtocol"
               connectionTimeout="20000"
redirectPort="8443" />The messages used in the tests are duplicated from
{
  "meta": {
    "type": "EiffelActi\"\"vityStartedEvent",
    "version": "1.0",
    "time": 1234567890,
    "domainId": "example.domain",
    "id": "aaaaaaaa-bbbb-cccc-dddd-eeeeeeeeeee0^^^^"
  },
  "data": {
    "executionUri": "https://my.jenkins.host/myJob/43",
    "liveLogs": [
      {
       "name": "My build log",
       "uri": "file:///tmp/logs/data.log"
      }
    ]
  },
  "links": {
    "activityExecution": "aaaaaaaa-bbbb-cccc-dddd-eeeeeeeeeee1",
    "previousActivityExecution": "aaaaaaaa-bbbb-cccc-dddd-eeeeeeeeeee2"
  }
}
More input samples can be found in bash-json.tar.gz.
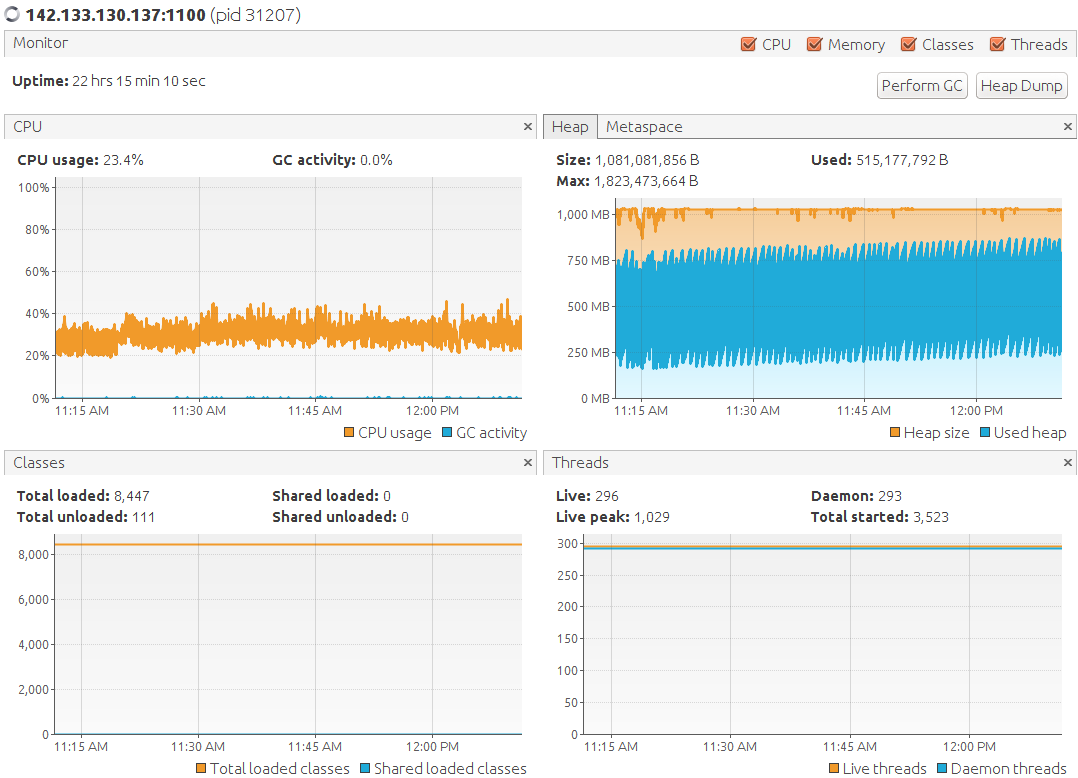
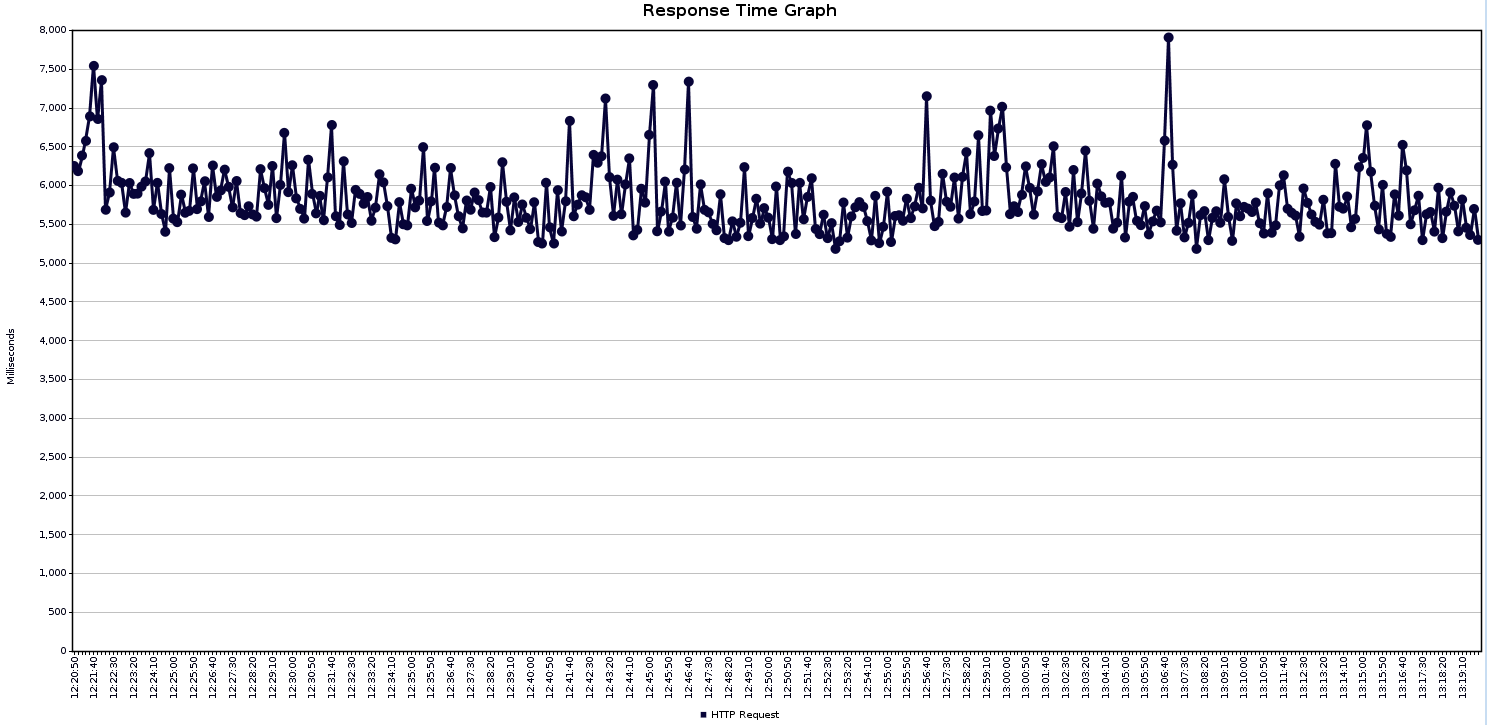
| concurrent threads/sec | array length in request body | message rate | response time graph | cpu/mem |
|---|---|---|---|---|
| 500 | 1 |  |
 |
 |
| 500 | 10 |  |
 |
 |
| 500 | 100 |  |
 |
 |
Note that the message rate did not reach 50k/sec as we expected and that the response time of the HTTP calls became slow (6 -7 seconds). We believe that we reach the performance bottleneck under the current computing resources.