Map visualization
First, make sure you have an instance of roscore running. If not, you can start it in a terminal
roscore &
Then, start the maplab console:
rosrun maplab_console maplab_console
Now, load a map, and visualize it:
load --map_folder MH_01_easy  # or any other VI map you have.
v
The command v publishes the map via the ROS messages (and registers the corresponding ROS topics). Start RViz in a new terminal:
rviz
On the Displays pane on the left side, click on Add. (If you don't have the Displays pane, you can get it via Panels -> Displays)

Click on the tab By topic and select a topic to visualize and click OK on the bottom right:

Start the maplab console:
rosrun maplab_console maplab_console
Load a map, and visualize it:
load --map_folder MH_01_easy  # or any other VI map you have.
v
This will publish the following topics to RViz:
-
vi_map_baseframe: Baseframes of the individual missions of the maps. -
vi_map_edges/viwls: Edges of the VI map. Visualization of edges:
-
vi_map_vertices: Vertex transformations. Visualzation of edges and vertices: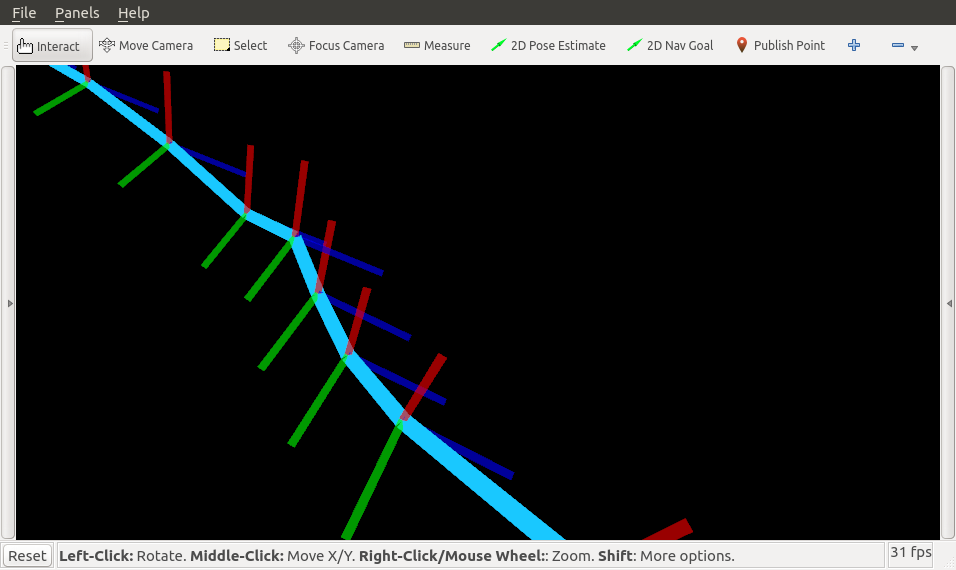
-
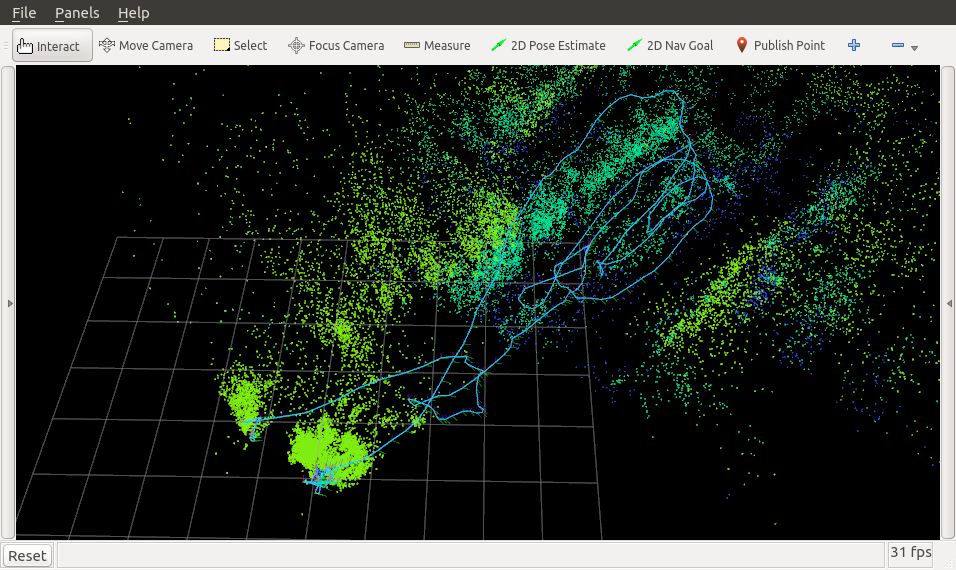
vi_map_landmarks: Point cloud of all landmarks. Visualization of edges, vertices and landmarks: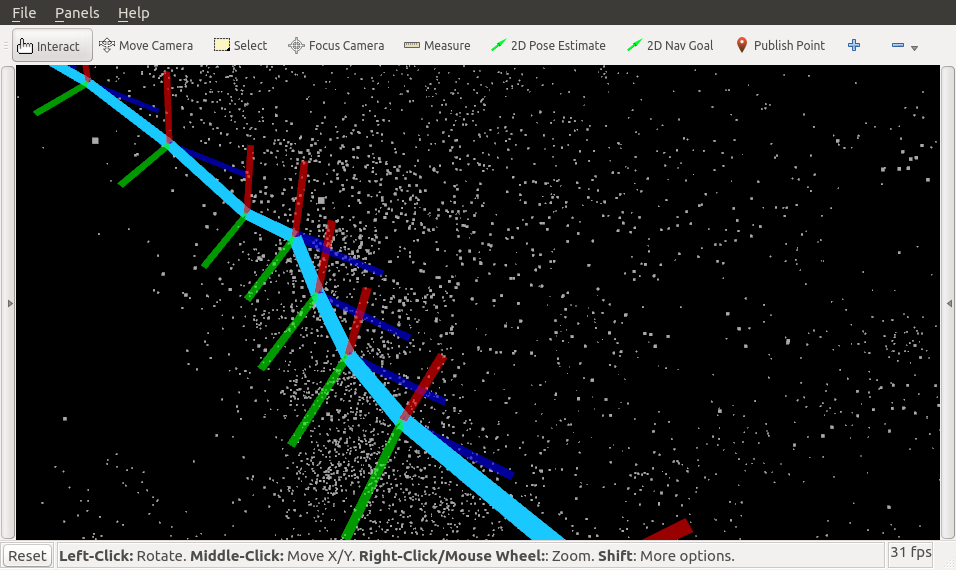
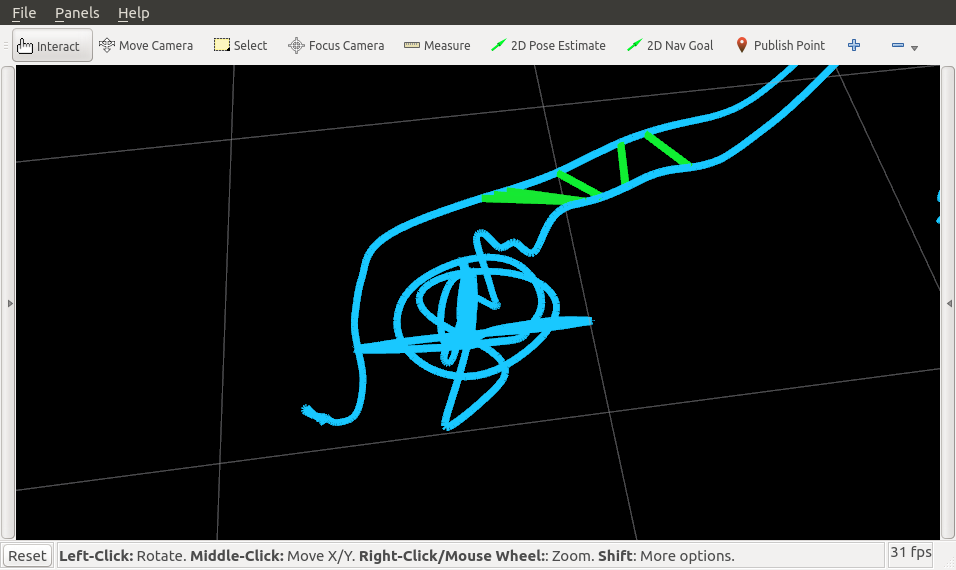
Loop closing a map (with the lc command) adds the visualization topic loop_closures, which will show merged landmark pairs:
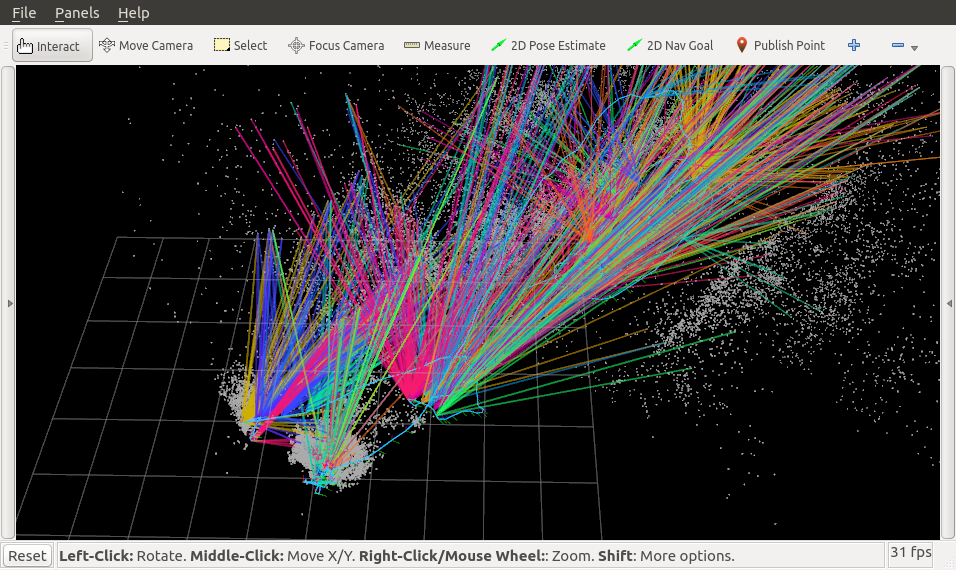
Running relax adds the topic vi_map_edges/loop_closure to the list and displays loop closure edges between vertices that can be loop-closed:

-
vis_scale: Sets the size of the edges.
-
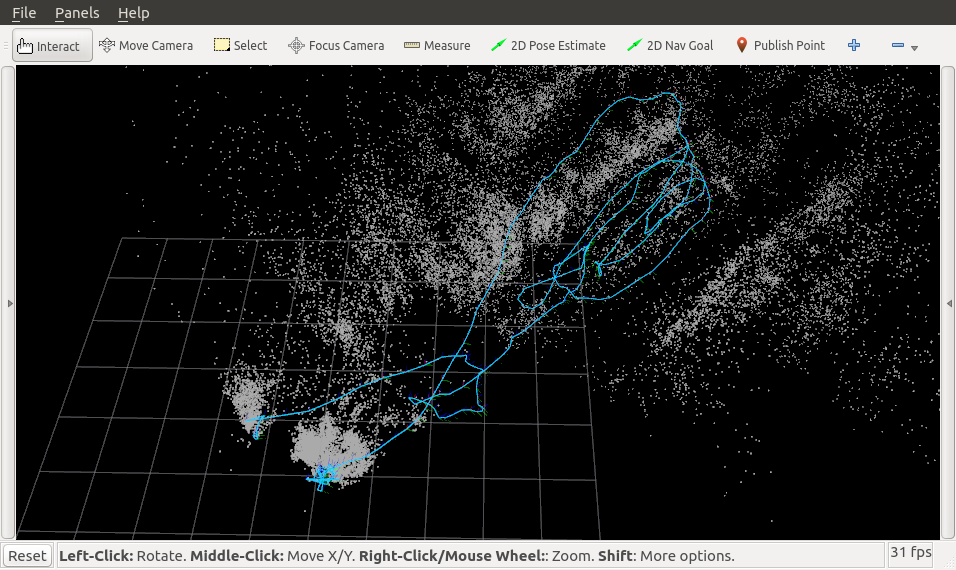
vis_color_by_mission: colors the landmarks and edges of each mission differently. This is enabled by default. -
vis_color_landmarks_by_height: Colors the landmarks by height. Use with these additional flags:vis_color_by_height_period_mvis_color_by_height_offset_m
-
vis_color_salt: Changes the rotation of the colors, e.g.
Salt 1 (default value):
v --vis_color_by_mission --vis_color_salt 1

Salt 70:
v --vis_color_by_mission --vis_color_salt 70

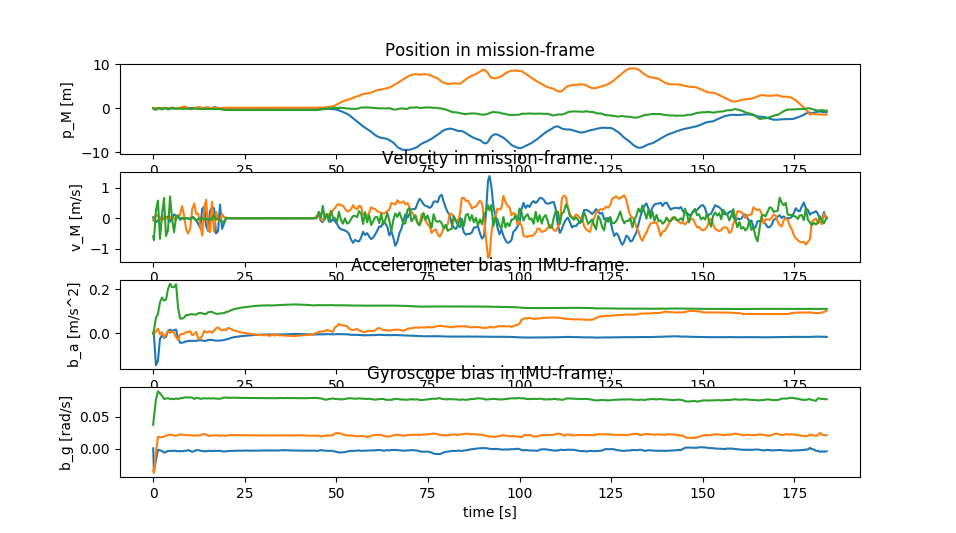
You can use
plot_vi_states_of_missionto plot the VI states of a mission.
This will open a plot with the position, velocity, and accelerometer/gyroscope biases. This may be helpful for tuning the IMU parameters or better understanding what happens during the batch optimization.