v5.2.0
Features
-
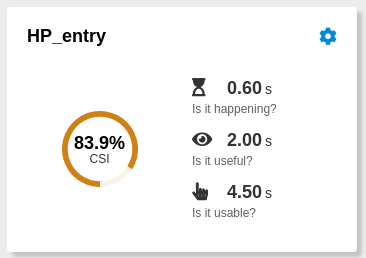
With Performance Aspects we introduced a new layer of abstraction on top of concrete performance metrics. We chose three of the "moments in user perception" Philip Walton described in his brilliant article about user-centric performance metrics as pre-defined performance aspects: Is it happening?, Is it useful? and Is it usable?.
-
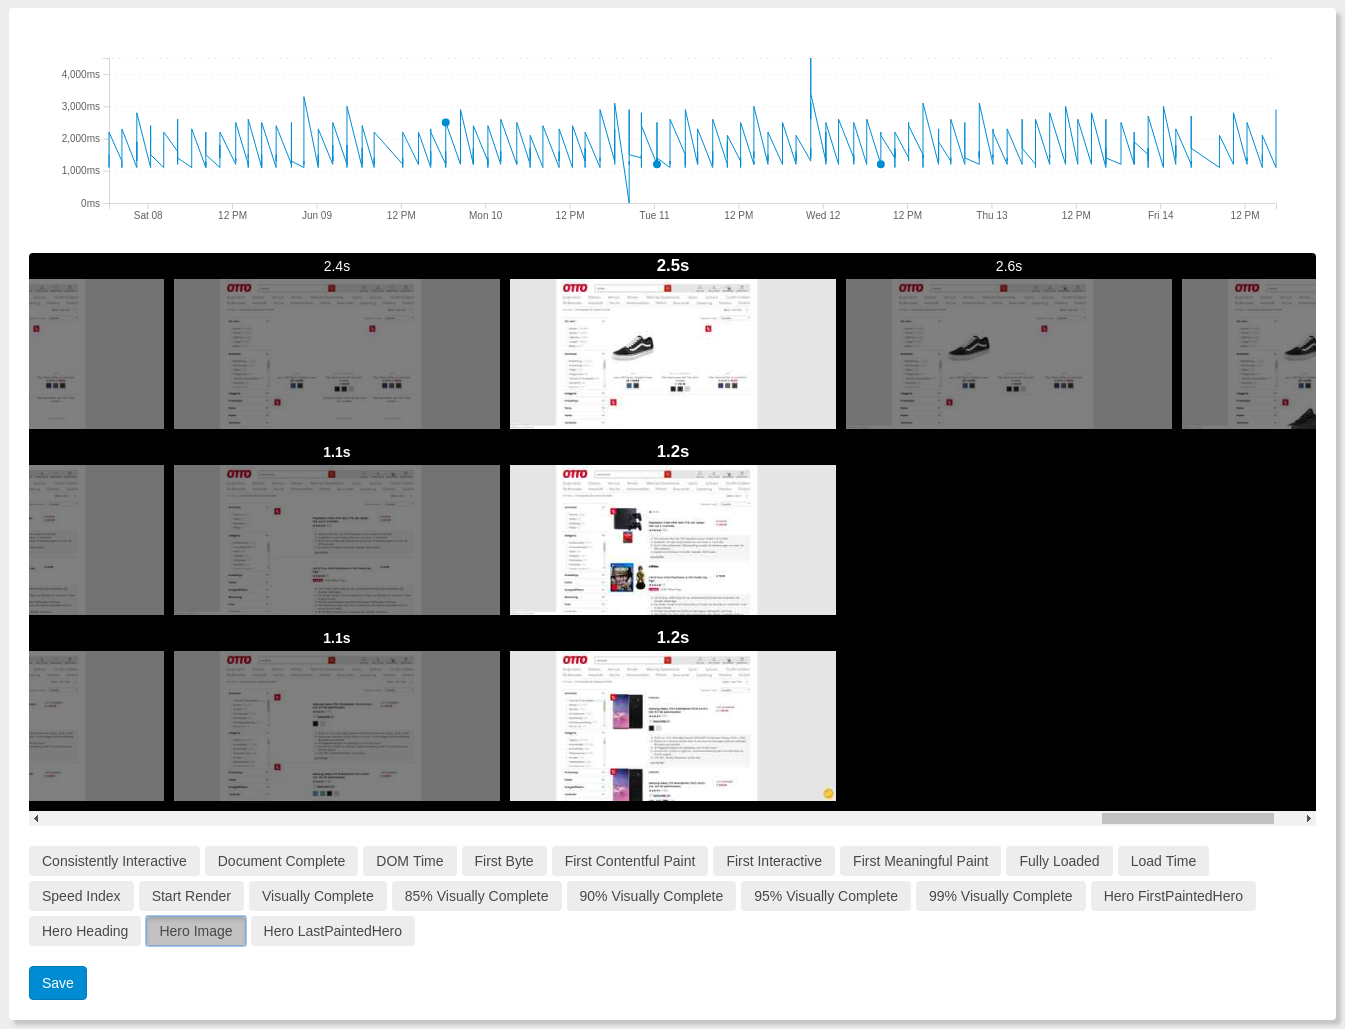
A new OpenSpeedMonitor view may be used to choose concrete metrics that represent the aspects for each browser and/or device. This view provides the possibility to choose metrics by a visual comparison of WebPagetest timeframes.
-
The average measured times for these aspects are shown for each page on application dashboard.
-
We combined dashboards for Page and JobGroup aggregation into one single Aggregation board. From now on this dashboard provides all the different possibilities for aggregation.
-
Until now a measured step was marked successful when either doc complete or fully loaded time exist. Now just one of the following metrics must have a value:
- ttfb
- start-render
- visually complete 100 %
- Speed Index
- Doc Complete
- Fully Loaded
-
Applications shown on homepage are now sorted by their overall performance (Customer Satisfaction Index).
-
Rewritten result selection controls in angular in preparation of a rewrite of all the result dashboards.
Bugfixes
-
Statuscode
12999is not really an error in WebPagetest. So we excluded it from status codes marking failed tests in OpenSpeedMonitor. -
Filter in Job List view lost entries if some of the jobs ran (page reload needed to see them again).

