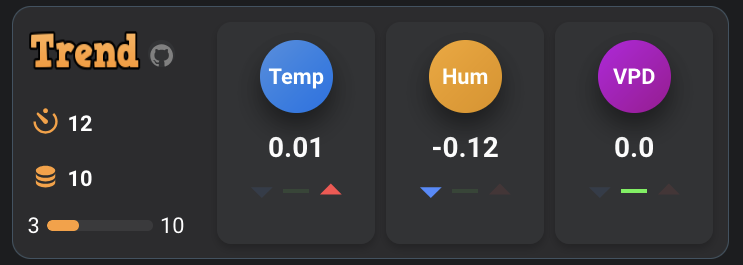
A custom Home Assistant integration, that calculates trend values for entities and displays result in a nice way.
Currently only up to three entities are supported, but this will change in the near future.
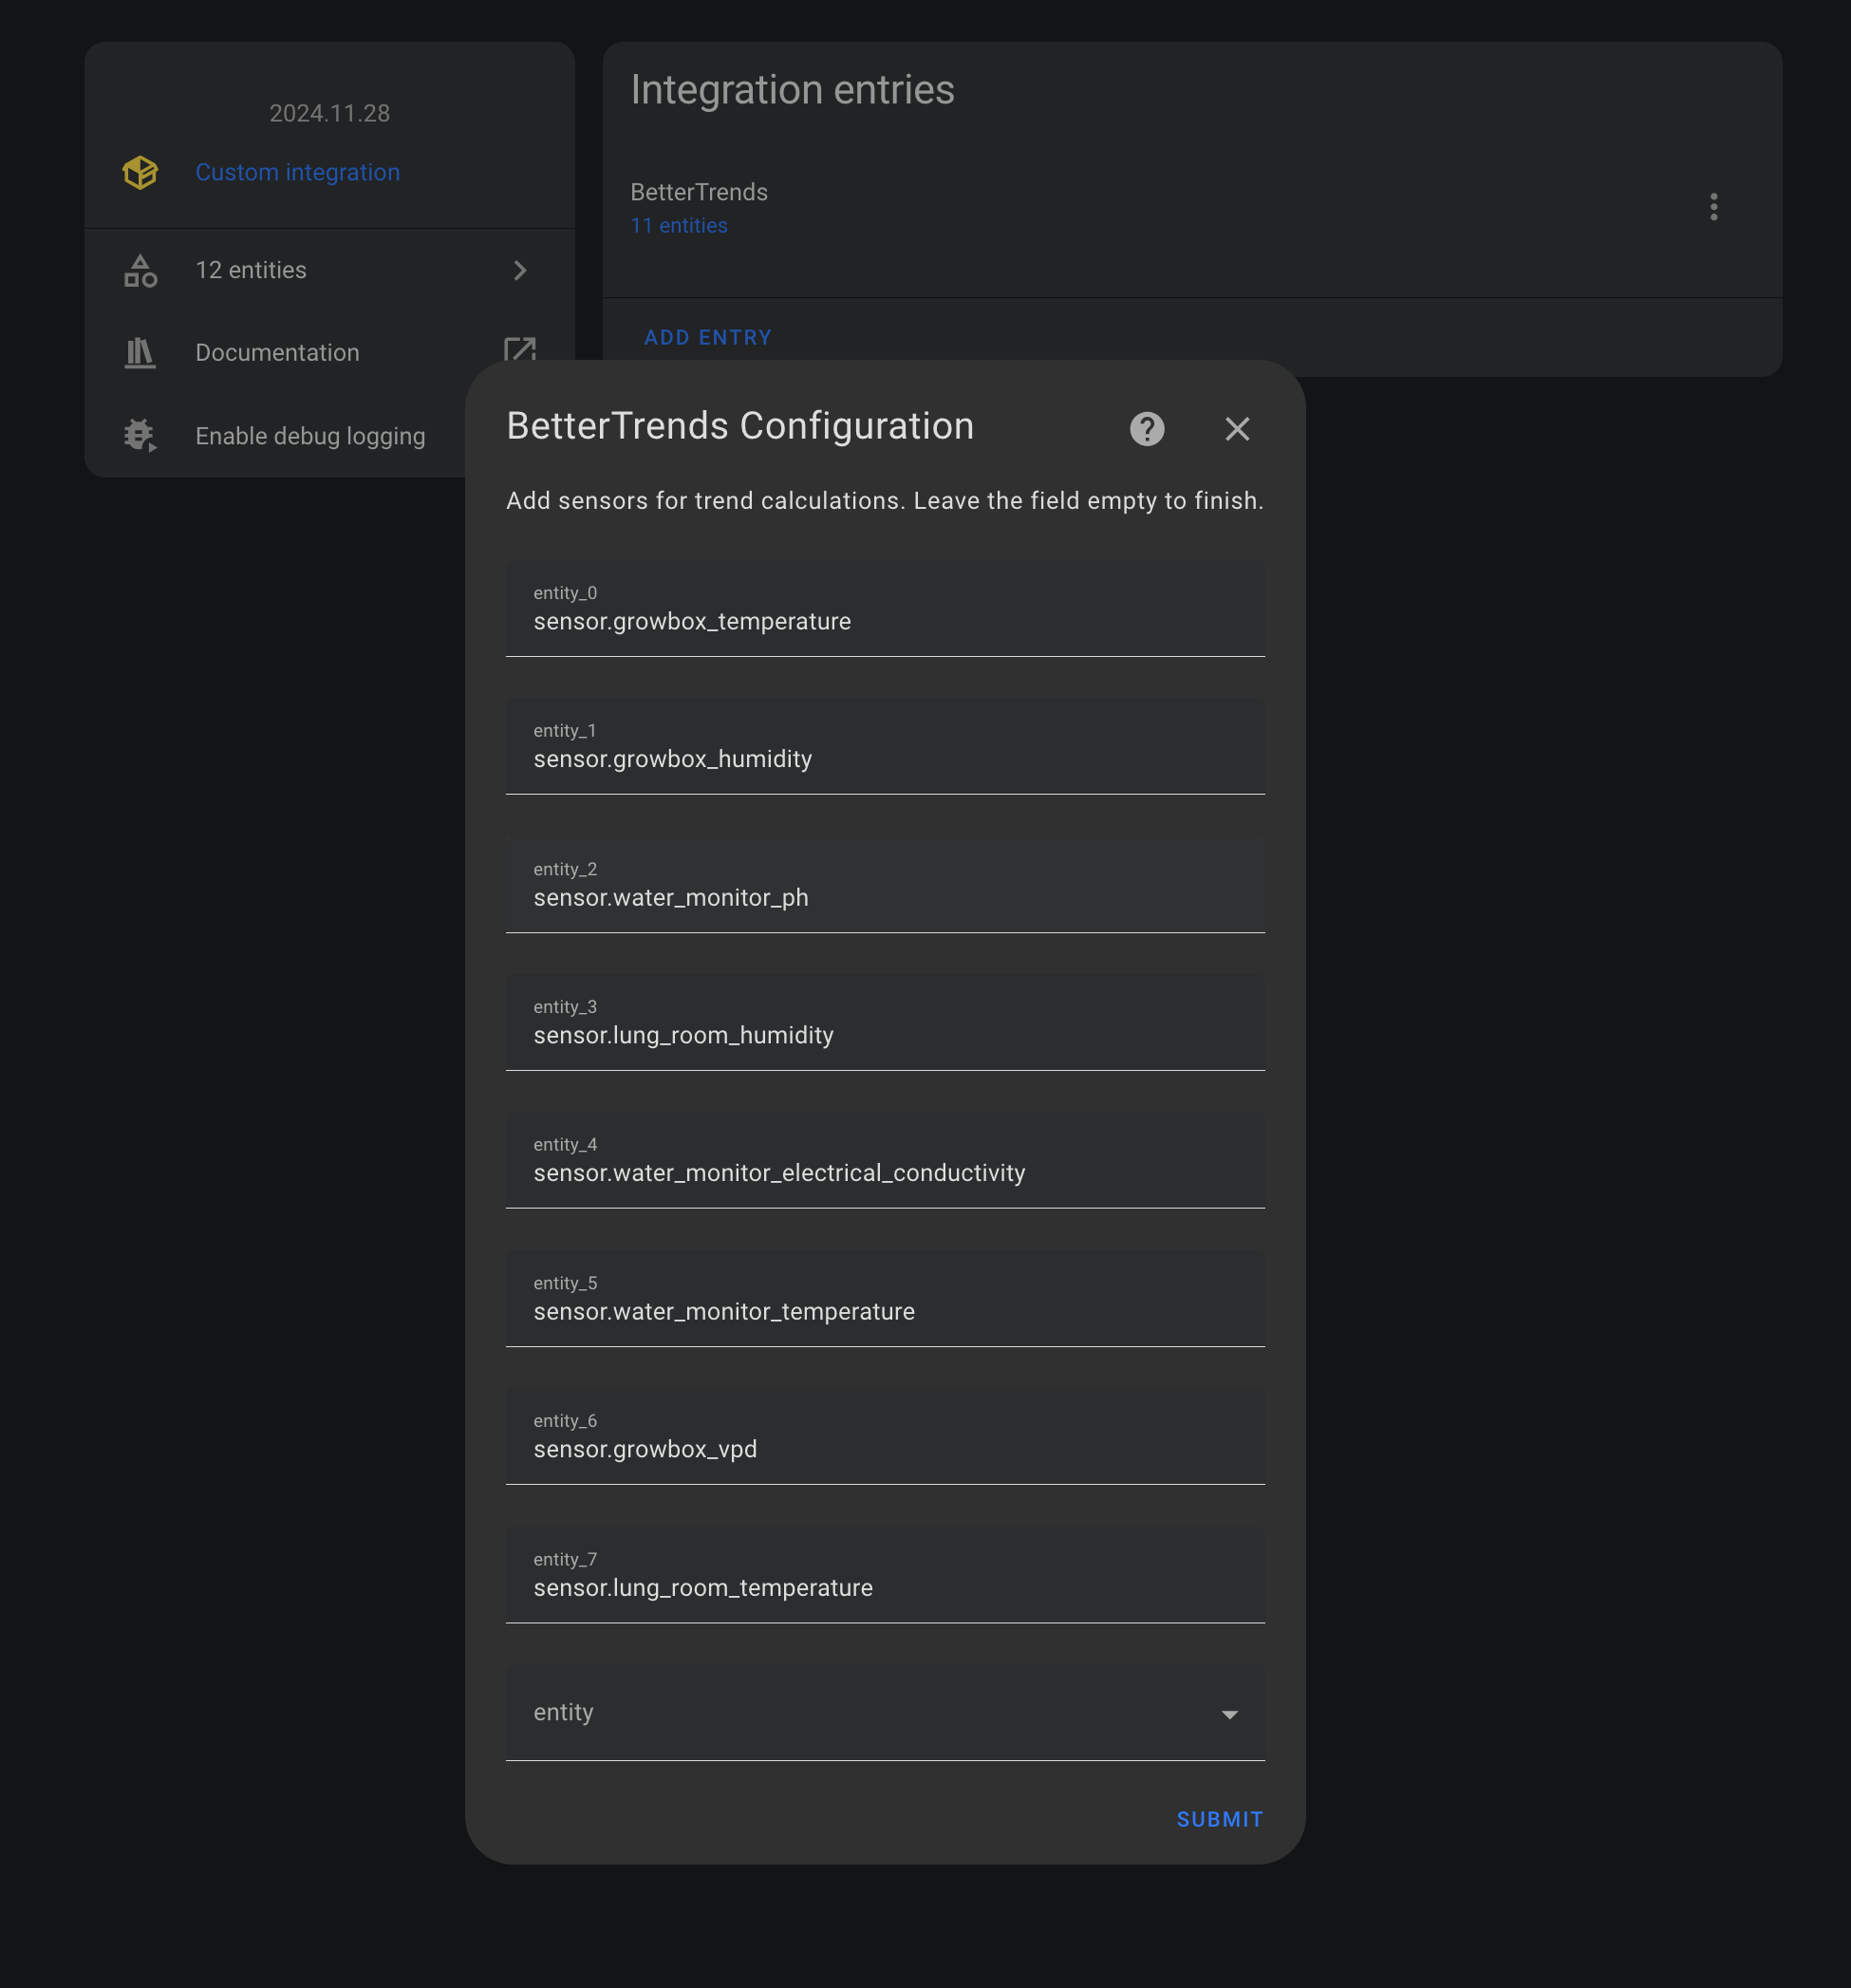
- Add your existing entities to calculate trend for
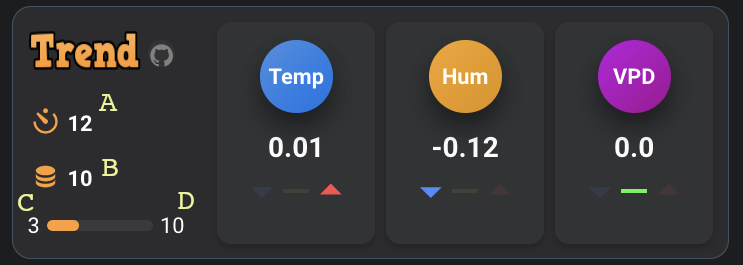
- Entities data is fetched every (A) seconds
- If (B) entity data sets are fetched, trend is calculated and sensor.bettertrends_sensor_<your_entity> is updated.
- A: data fetch interval
- B: datasets fetched before calculating new trend value
- C: current datasets collected
- D: Total datasets required to calculate trend value (equals B)
You can click on A (interval), or B (steps) to change number.
- Ensure you have HACS installed.
- In Home Assistant, go to HACS > Frontend.
- Click the "+" button to add a new repository.
- Enter the repository URL:
https://github.com/maziggy/BetterTrends.git. - Select Integration as the category and Save.
or simply
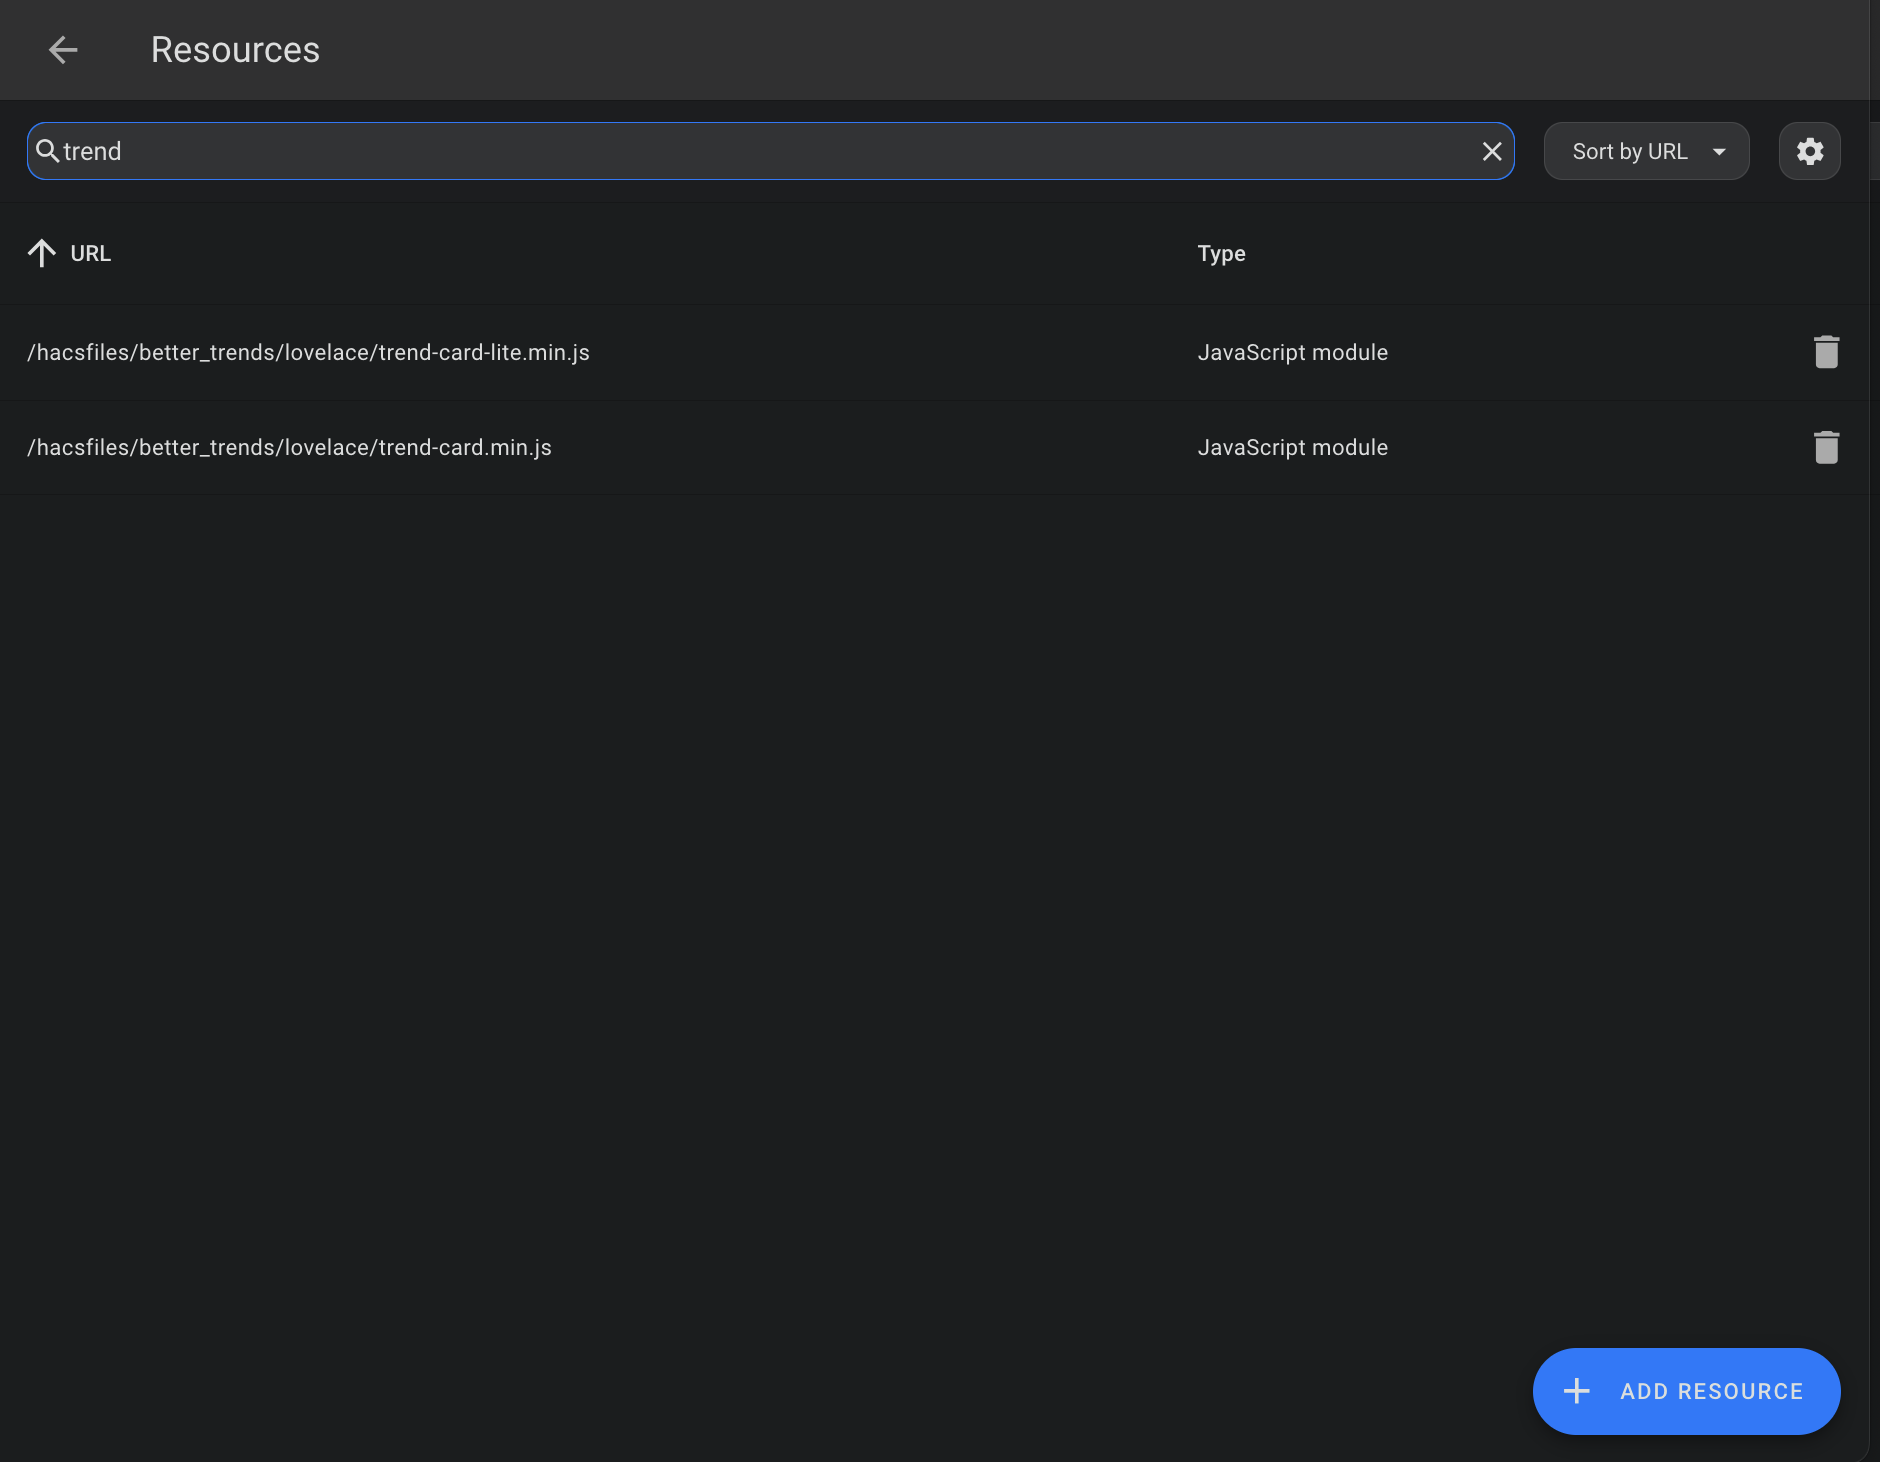
- Once installed, you'll get a persitant notification about how to add the two included dashboard cards (trend-card and trend-card-lite) to your resources.
type: custom:trend-card
interval: number.bettertrends_interval
steps: number.bettertrends_steps
current_step: number.bettertrends_current_step
metric1_delta: sensor.bettertrends_<your_sensor_1>
metric1_name: <name>
metric2_delta: sensor.bettertrends_<your_sensor_2>
metric2_name: <name>
metric3_delta: sensor.bettertrends_<your_sensor_3>
metric3_name: <name>
theme:
  bgColor: "#2c2c2e"
  textColor: "#ffffff"
  iconColor: "#ff9e32"
  iconBgColor: "#323335"
  metricBgColor: "#323335"
  bubble1Color: "#1b7de5"
  bubble1TextColor: "#ffffff"
  value1TextColor: "#ffffff"
  bubble2Color: "#e7970d"
  bubble2TextColor: "#ffffff"
  value2TextColor: "#ffffff"
  bubble3Color: "#ab07ae"
  bubble3TextColor: "#ffffff"
  value3TextColor: "#ffffff"
  trendDownColor: "#498bff"
  trendEqualColor: "#4ff24b"
trendUpColor: "#ff4c4c"type: custom:trend-card-lite
metric1_delta: sensor.bettertrends_<your_sensor_1>
metric1_delta_name: <name>
metric2_delta: sensor.bettertrends_<your_sensor_2>
metric2_delta_name: <name>
metric3_delta: sensor.bettertrends_<your_sensor_3>
metric3_delta_name: <name>
theme:
bgColor: "#2c2c2e"
metricBgColor: "#212122"
bubble1Color: "#2b8dd9"
bubble1TextColor: "#ffffff"
value1TextColor: "#ffffff"
bubble2Color: "#e7970d"
bubble2TextColor: "#ffffff"
value2TextColor: "#ffffff"
bubble3Color: "#ab07ae"
bubble3TextColor: "#ffffff"
value3TextColor: "#ffffff"
trendDownColor: "#498bff"
trendEqualColor: "#4ff24b"
trendUpColor: "#ff4c4c"


