-
-
Notifications
You must be signed in to change notification settings - Fork 7
Plotting functions
kojix2 edited this page Jun 15, 2020
·
30 revisions
you'll need the ruby-gr, numo-narray gems.
require 'gr/plot'
require 'numo/narray'Draw one or more line plots.
x = Numo::DFloat.linspace(0, 10, 1001)
y = Numo::NMath.sin(x)

GR.plot(x, y)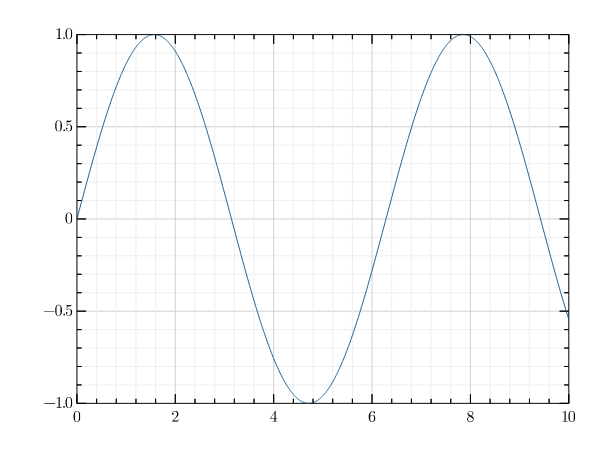
Draw one or more staircase or step plots.
- where: mid pre post
x = Numo::DFloat.linspace(0, 10, 51)
y = Numo::NMath.sin(x)

GR.step(x, y)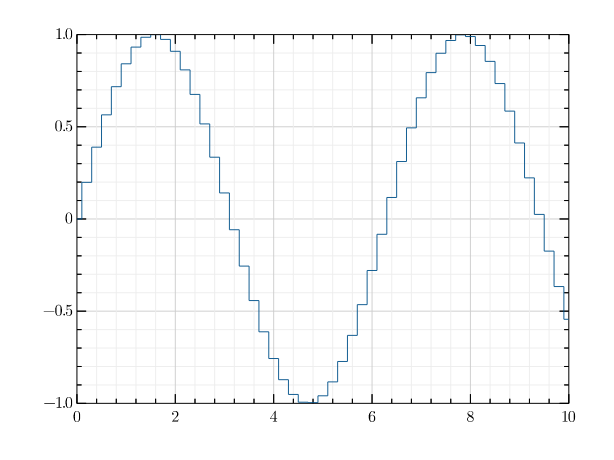
Draw one or more three-dimensional line plots.
x = Numo::DFloat.linspace(0, 30, 1000)
y = Numo::NMath.cos(x) * x
z = Numo::NMath.sin(x) * x

GR.plot3(x, y, z)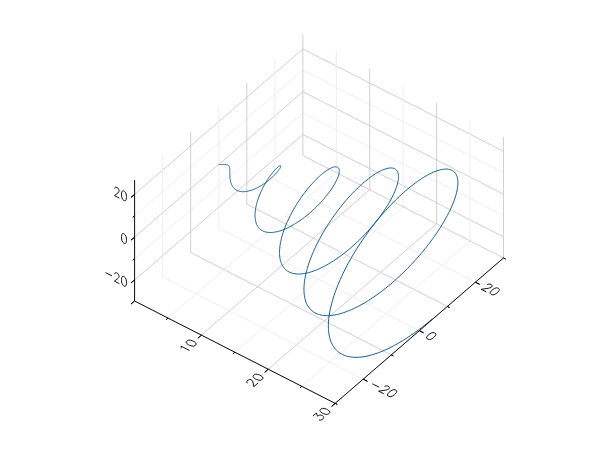
Draw one or more polar plots.
angles = Numo::DFloat.linspace(0, 2 * Math::PI, 40)
radii = Numo::DFloat.linspace(0, 20, 40)

GR.polar(angles, radii)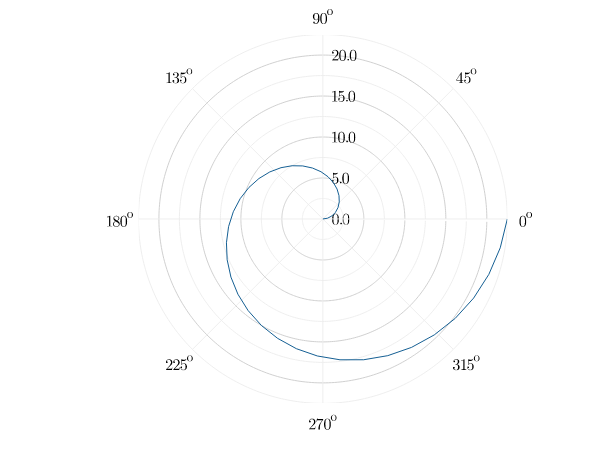
Draw a scatter plot.
x = Numo::DFloat.linspace(0, 1, 51)
y = x - x**2
s = x * 200

GR.scatter(x, y, s)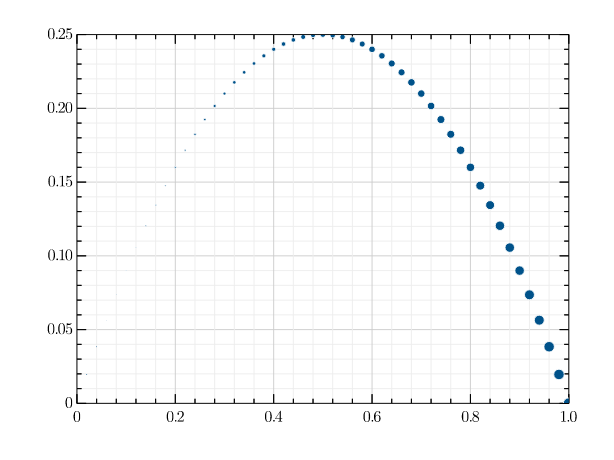
x = Numo::DFloat.linspace(0, 1, 51)
y = x - x**2
s = Numo::DFloat.linspace(50, 300, x.size)
c = Numo::DFloat.linspace(0, 255, x.size)

GR.scatter(x, y, s, c)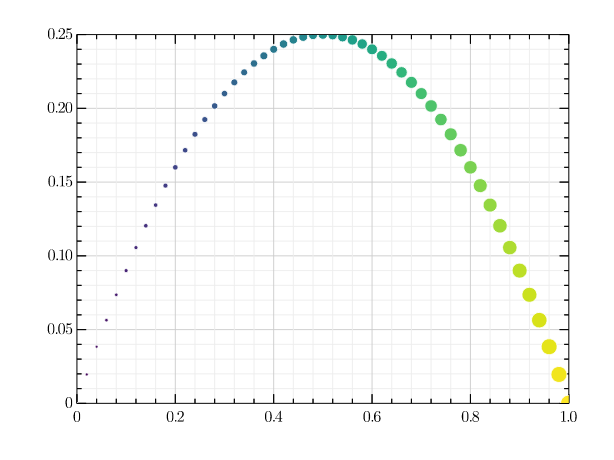
Draw a three-dimensional scatter plot.
x = 2 * Numo::DFloat.new(100).rand - 1
y = 2 * Numo::DFloat.new(100).rand - 1
z = 2 * Numo::DFloat.new(100).rand - 1
c = 999 * Numo::DFloat.new(100).rand + 1

GR.scatter3(x, y, z, c)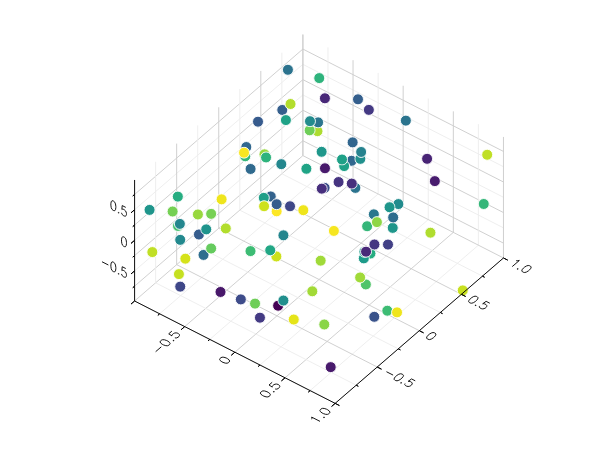
Draw a stem plot.
x = Numo::DFloat.linspace(-2, 2, 40)
y = x ** 3 + x ** 2 + x + 6

GR.stem(x, y)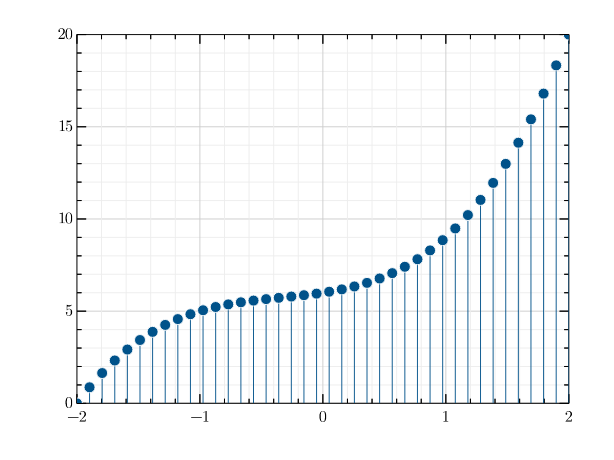
Draw a bar plot.
- horizontal: true false
continents = ["Africa", "America", "Asia", "Europe", "Oceania"]
population_2010 = [1044, 944, 4170, 735, 36]

GR.barplot(continents, population_2010)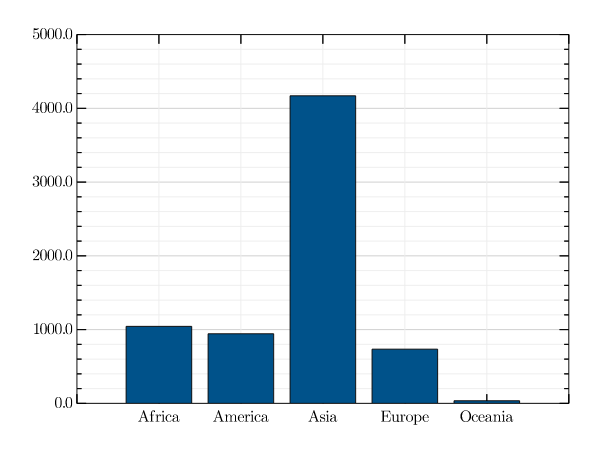
Draw a histogram of data.
- nbins: Integer
x = Numo::DFloat.new(10_000).rand_norm

GR.histogram(x)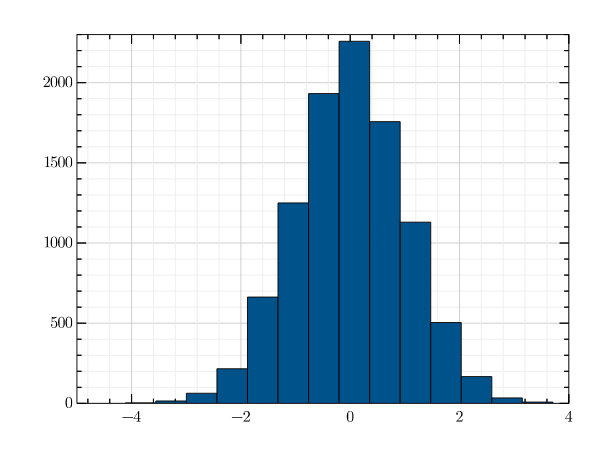
Draw a hexagon binning plot.
- nbins: Integer
x = Numo::DFloat.new(10_000).rand_norm
y = Numo::DFloat.new(10_000).rand_norm

GR.hexbin(x, y)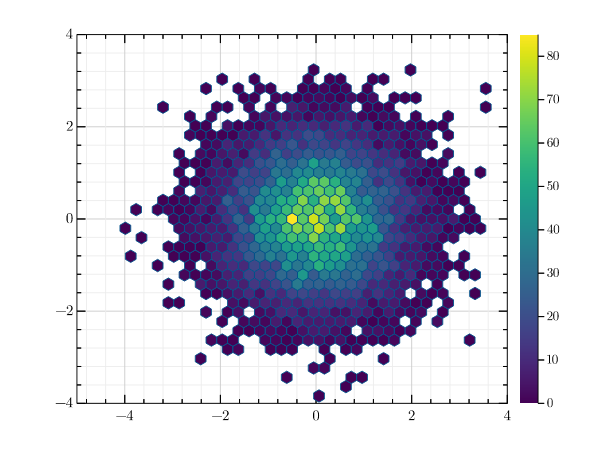
x = 8 * Numo::DFloat.new(60).rand - 4
y = 8 * Numo::DFloat.new(60).rand - 4
z = Numo::NMath.sin(x) + Numo::NMath.cos(y)

GR.contour(x, y, z)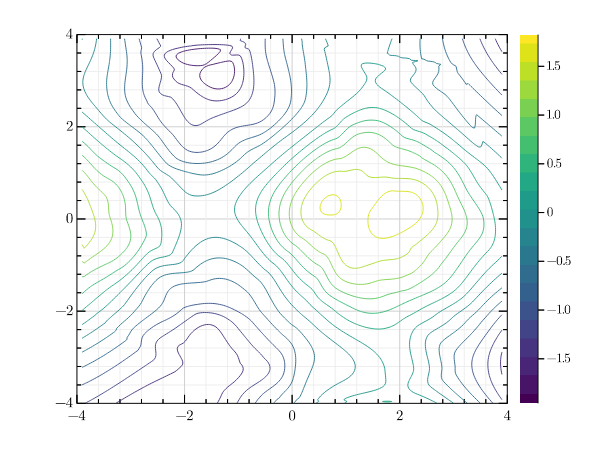
_x = Numo::DFloat.linspace(-2, 2, 40)
_y = Numo::DFloat.linspace(0, Math::PI, 20)
x = (_x.expand_dims(0) * Numo::DFloat.ones(_y.size, 1)).flatten
y = (_y.expand_dims(1) * Numo::DFloat.ones(1, _x.size)).flatten
z = (Numo::NMath.sin(x) + Numo::NMath.cos(y)).flatten

GR.contour(x, y, z)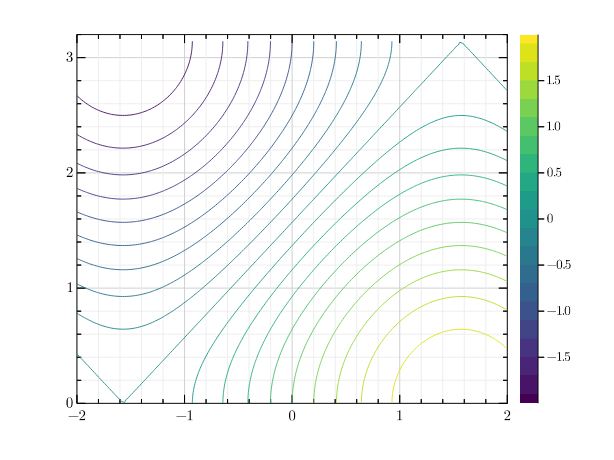
x = 8 * Numo::DFloat.new(100).rand - 4
y = 8 * Numo::DFloat.new(100).rand - 4
z = Numo::NMath.sin(x) + Numo::NMath.cos(y)

GR.contourf(x, y, z)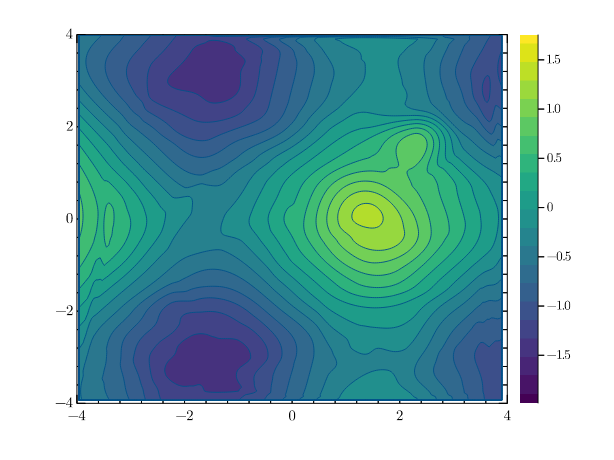
x = 8 * Numo::DFloat.new(300).rand - 4
y = 8 * Numo::DFloat.new(300).rand - 4
z = Numo::NMath.sin(x) + Numo::NMath.cos(y)

GR.tricont(x, y, z)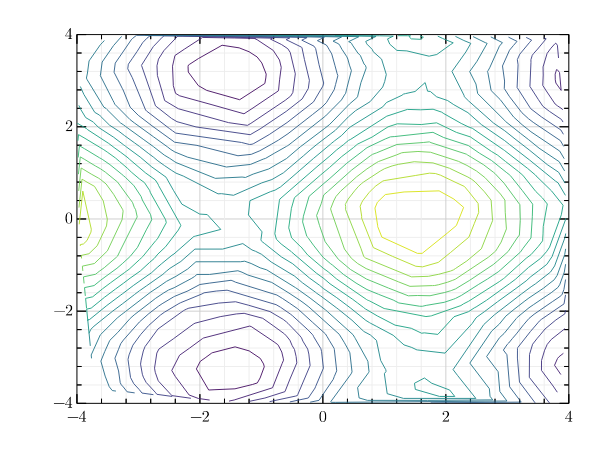
- keyword arguments
- accelerate
x = 8 * Numo::DFloat.new(100).rand - 4
y = 8 * Numo::DFloat.new(100).rand - 4
z = Numo::NMath.sin(x) + Numo::NMath.cos(y)

GR.surface(x, y, z)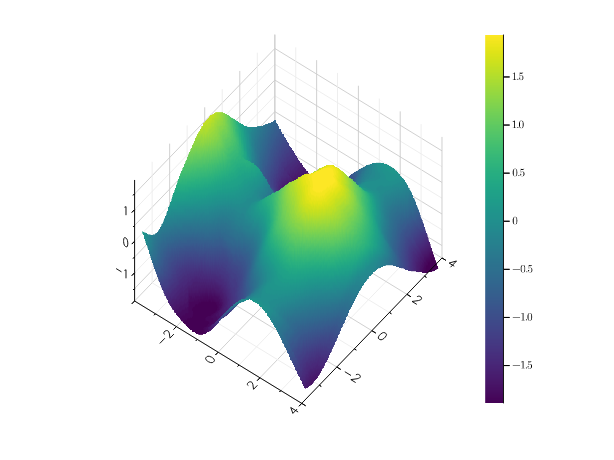
x = 8 * Numo::DFloat.new(100).rand - 4
y = 8 * Numo::DFloat.new(100).rand - 4
z = Numo::NMath.sin(x) + Numo::NMath.cos(y)

GR.trisurf(x, y, z)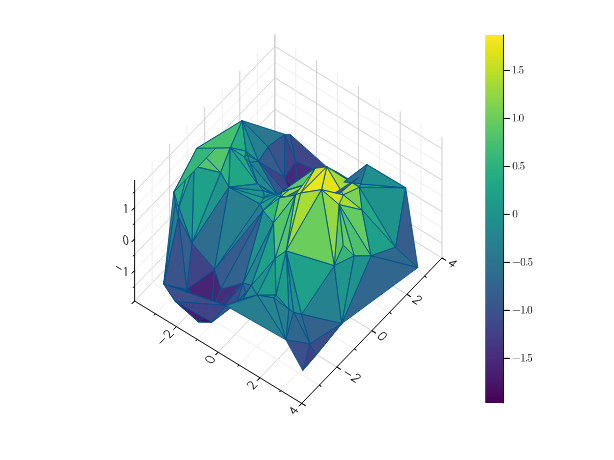
x = 8 * Numo::DFloat.new(1000).rand - 4
y = 8 * Numo::DFloat.new(1000).rand - 4
z = Numo::NMath.sin(x) + Numo::NMath.cos(y)

GR.wireframe(x, y, z)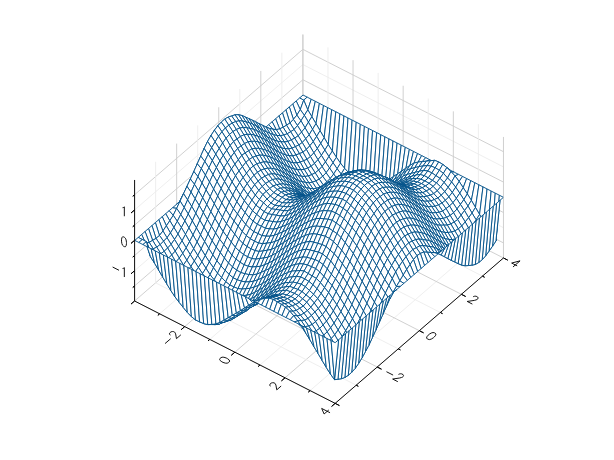
- keyword arguments
- algorithm
z = Numo::DFloat.new(50, 50, 50).rand_norm

GR.volume(z)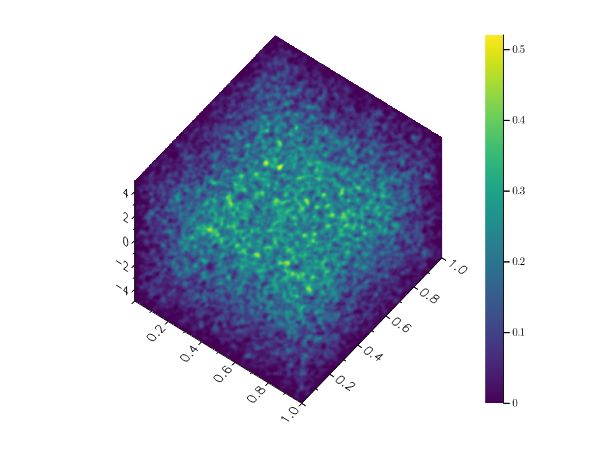
x = Numo::DFloat.linspace(-2, 2, 40)
y = Numo::DFloat.linspace(0, Math::PI, 20)
z = Numo::NMath.sin(x).expand_dims(0).transpose + Numo::NMath.cos(y)

GR.heatmap(z)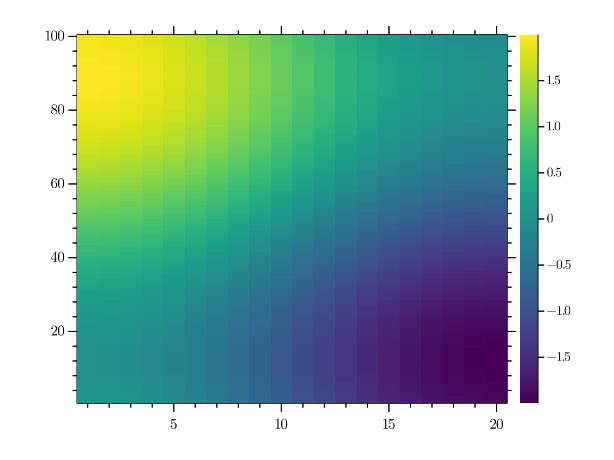
n = 1_000_000
x = Numo::DFloat.new(n).rand_norm
y = Numo::DFloat.new(n).rand_norm

GR.shade(x, y)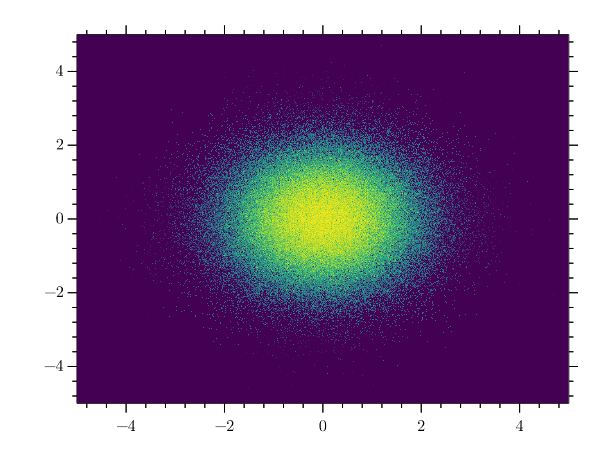
x = Numo::DFloat.linspace(-1, 1, 20)
y = Numo::DFloat.linspace(0, Math::PI, 30)
z = Numo::NMath.sin(x).expand_dims(0).transpose + Numo::NMath.cos(y)

GR.imshow(z)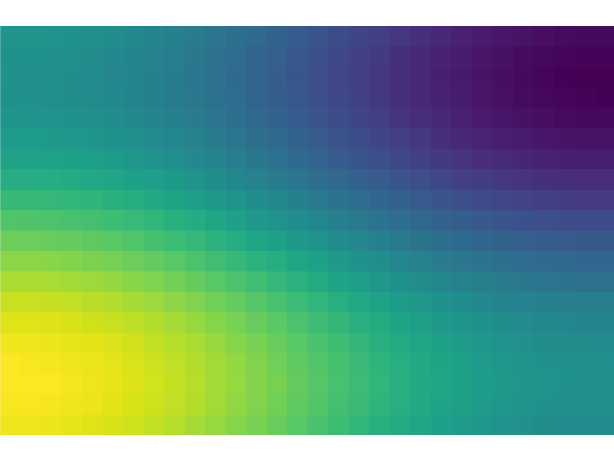
s = Numo::DFloat.linspace(-0.6, 0.6, 50)
v = 1 - ((s**2 +  (s**2).expand_dims(0).transpose).expand_dims(2) + s.reshape(1, 1, true)**2)**0.5

GR.isosurface(v)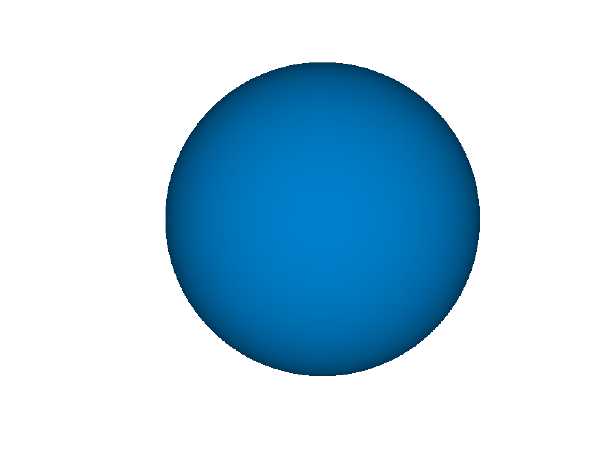
User's Guide
Simple, matlab-style API
- Plotting functions
- Plot attributes
- Multiple plots
- Multiple subplots
- Save Plot to a file
- Jupyter Notebook
GR Native functions
For developers