This is an Alpine Linux based Docker Container to run the latest version of gnuplot.
The gnuplot binary is being compiled from source and also configured to use
- gdlib incl. TTF support
- cairo
- lua
Basic TTF fonts like Arial are also included, so the generated e.g. PNGs using gdlib should look good and without any warnings.
This image will call the gnuplot binary using /work as WORKDIR.
Map a local directory to /work provide either a gnuplot script or use the
-e parameter to supply a "command list" as parameter (see the example section).
docker run --rm -v $(pwd):/work remuslazar/gnuplot your_file.gnu
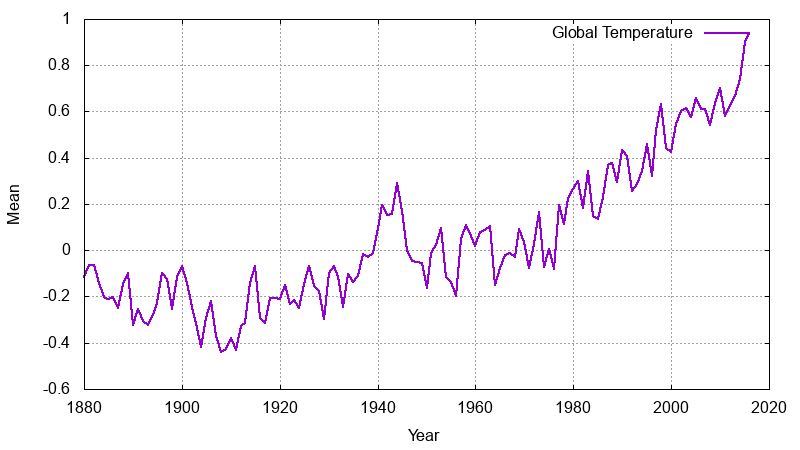
In this example we will plot the Global Temperature Time Series.
# fetch yearly sample data from https://datahub.io/core/global-temp
curl -L https://datahub.io/core/global-temp/r/annual.csv > global-temp-data.csv

# generate the plot
docker run --rm -v $(pwd):/work remuslazar/gnuplot -e \
 "set xlabel 'Year'; set ylabel 'Mean';
  set grid;
  set datafile separator ',';
  set term png size 800,380;
  set output 'global-temp.png';
  plot 'global-temp-data.csv' every 2::0 skip 1 using 2:3 title 'Global Temperature' with lines linewidth 2;"
This will product a PNG file called global-temp.png in the cwd.
See also the files in the examples/ folder for how to plot multiple data sets.
To run a shell inside the container:
docker run --rm -it -v $(pwd):/work --entrypoint /bin/sh remuslazar/gnuplot
Remus Lazar (remus at lazar dot info)
See LICENSE.


