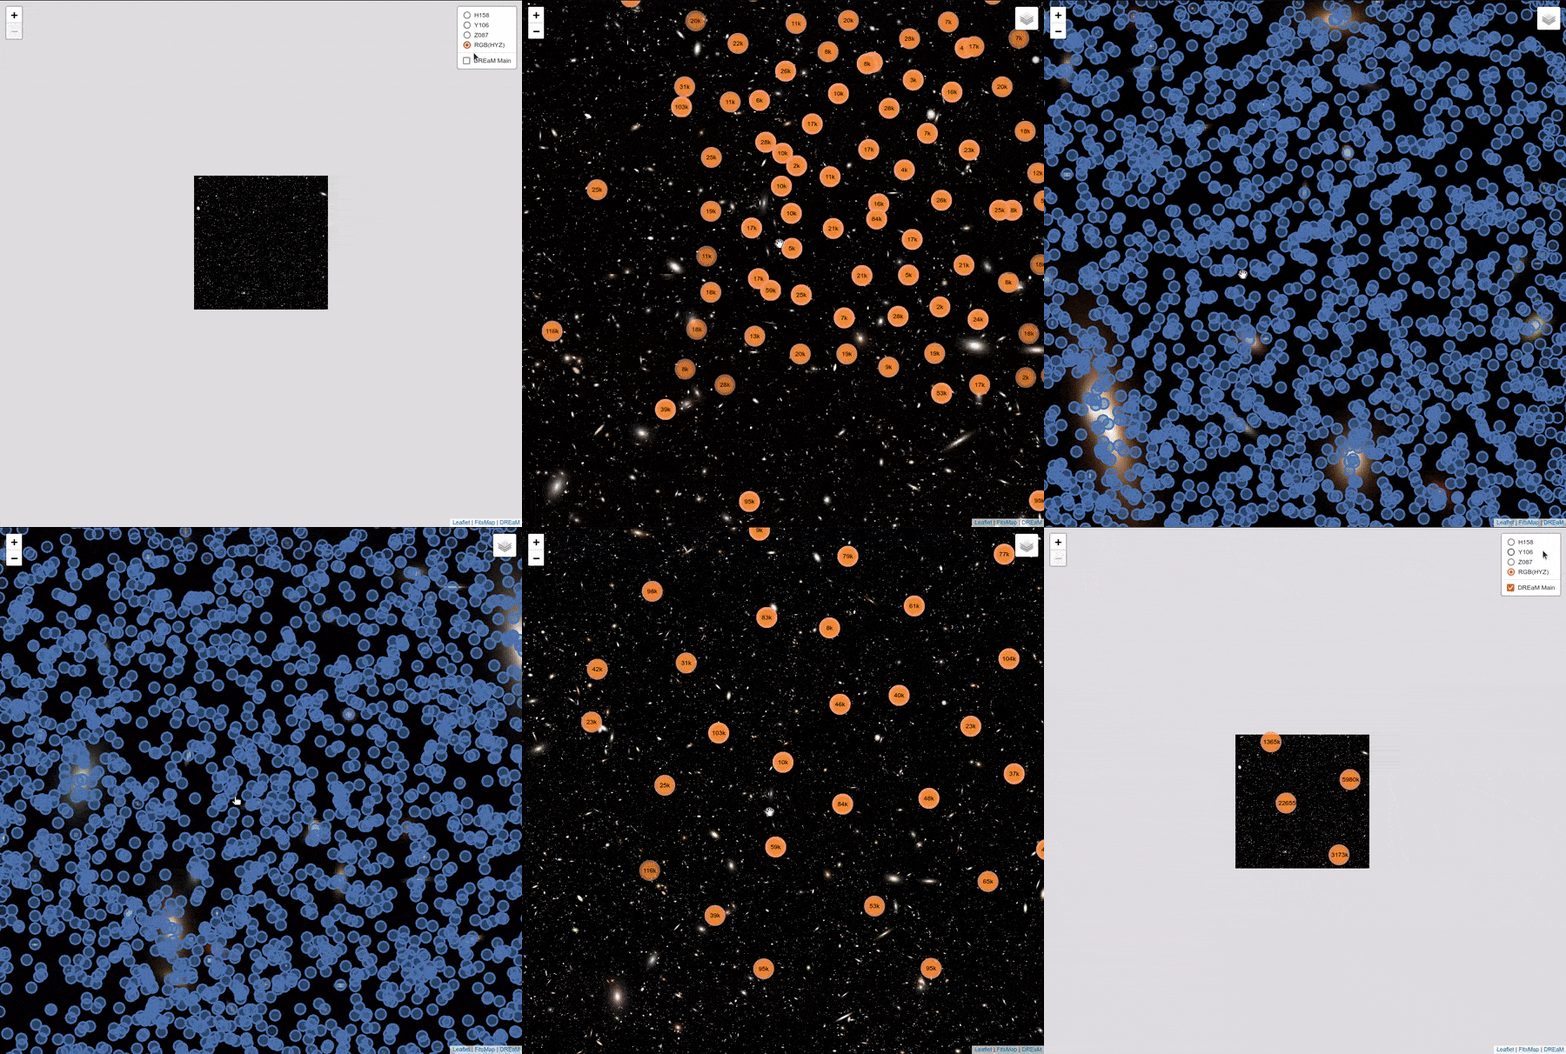

FitsMap is a tool developed in the Computational Astrophysics Research Group at UC Santa Cruz for displaying astronomical images and their associated catalogs, powered by LeafletJS.
Survey images can have dimensions in the tens of thousands of pixels in multiple
bands. Examining images of this size can be difficult, especially in multiple
bands. Memory constraints and highly specialized tools like DS9 can make simple
high-level analysis infeasible or cumbersome. FitsMap addresses these two issues
by converting large fits files and images into tiles that can be presented using
LeafletJS. Another issue in examining survey images
is examining a catalog of sources in the context of the images. FitsMap
addresses this by converting a catalog of sources into JSON map markers, which
can be viewed in the webpage. Additionally, these sources are searchable using
the web interface by the column id.
Some sample websites that leverage FitsMap are:
Additional examples are welcome! If you'd like to add your use case here, submit an issue with the title "Use Case Example", and in the description, include the URL to the FitsMap along with a title and also a link to an associated paper if you'd like.
Here is an example using FitsMap to render a 32,727² image and ~33 million sources from the DReAM Galaxy Catalog:
Requirements:
astropycbor2clickmapbox_vector_tilematplotlibnumpypillowscikit-imageraytqdm
Use pip to install
pip install fitsmapFitsMap is designed to address the following example. A user has multiple FITS files or PNG files that represent multiple bands of the same area of the sky, along with a catalog of sources within that area. For example, the directory might look like:
- path/to/data/
  - F125W.fits
  - F160W.fits
  - RGB.png
  - catalog.cat
There are two FITS files (F125W.fits, F160W.fits), a PNG file
(RGB.png), and catalog (catalog.cat) containing sources visible in the
image files. To render these files using FitsMap you can use
fitsmap.convert.dir_to_map or fitsmap.convert.files_to_map.
Note: Currently FITS image data only pulled from the 0th extension and all other extensions are ignored. For non-FITS images, currently JPEG and PNG area supported. Further all catalog files must end in the extension .cat.
After the FitsMap has been generated you can view it in your web browser by
navigating to the directory containing the map (index.html) and running the
following command in the terminal:
fitsmap serveThis will start up a webserver and open your browser to the page containing the map. When your done with the map you can close your browser window and kill the process running in the terminal.
To convert this directory into a FitsMap using fitsmap.convert.dir_to_map:
from fitsmap import convert

convert.dir_to_map(
    "path/to/data",
    out_dir="path/to/data/map",
    cat_wcs_fits_file="path/to/data/F125W.fits",
    norm_kwargs=dict(stretch="log", max_percent=99.5),
)
The first argument is which directory contains the files that we would like to
convert into a map. In our case, this is path/to/dir. The next argument is
the out_dir keyword argument that tells FitsMap where to put the generated
webpage and supporting directories. In this example, the website will be built
in a new subdirectory called map within path/to/data. The argument
cat_wcs_fits_file keyword argument tells FitsMap which header to use to
parse any catalog files and convert them into map markers. The norm_kwargs
argument should be a dictionary of kwargs that get passed to
astropy.visulization.simple_norm
which is used to scale the FITS files before rendering.
Equivalently, using the FitsMap command line interface:
fitsmap dir --out_dir /path/to/data/map \
            --cat_wcs_fits_file "path/to/header_file.fits" \
            path/to/data
Note: The command line interface doesn't currently support norm_kwargs.
Run fitsmap --help for more information
Once FitsMap is finished, the following will have been generated:
- path/to/data/map/
  - F125W/
  - F160W/
  - RGB/
  - catalog/
  - css/
  - catalog_assets/
  - imgs/
  - js/
  - index.html
The directories F125W, F160W, RGB, catalog contain tiled
versions of the input fits files. The css directory contains some supporting
CSS files for clustering the markers and rendering pixels. The imgs
directory contains supporting images. The js directory contains supporting
JavaScript for the map. catalog_assets contains JSON files for each source
in each that are rendered when the marker associated with that source is
clicked. Finally, index.html is the webpage that contains the map.
To use the map, run fitsmap serve in the same directory as index.html
If you want to specify the files that get used to generate the map you can use function fitsmap.convert.files_to_map:
from fitsmap import convert

paths_to_files = [
    ...,
]

convert.files_to_map(
    paths_to_files,
    out_dir="path/to/data/map",
    cat_wcs_fits_file="path/to/header_file.fits",
    norm_kwargs=dict(stretch="log", max_percent=99.5),
)
This will produce a map in out_dir using the files that were passed in using
the paths_to_files variable.
The norm_kwargs argument to fitsmap.convert.dir_to_map and fitsmap.convert.files_to_map can be a
dictionary of kwargs where the keys are the filenames (not paths) and the values
are the simple_norm kwargs for that file. For example:
from fitsmap import convert

paths_to_files = [
    "fits_images/F125W.fits",
    "fits_images/F160W.fits",
]

convert.files_to_map(
    paths_to_files,
    out_dir="path/to/data/map",
    cat_wcs_fits_file="path/to/header_file.fits",
    norm_kwargs={
        "F125W.fits":dict(stretch="log", max_percent=99.5),
        "F160W.fits":dict(stretch="log", max_percent=99.9, min_percent=0.1),
    }
)FitsMap stores the current view (location/zoom) in the url. You can then share the view with others by sharing the url.
You can search the catalogs by the id column from the catalog and FitsMap
will locate and pan to the source in the map.
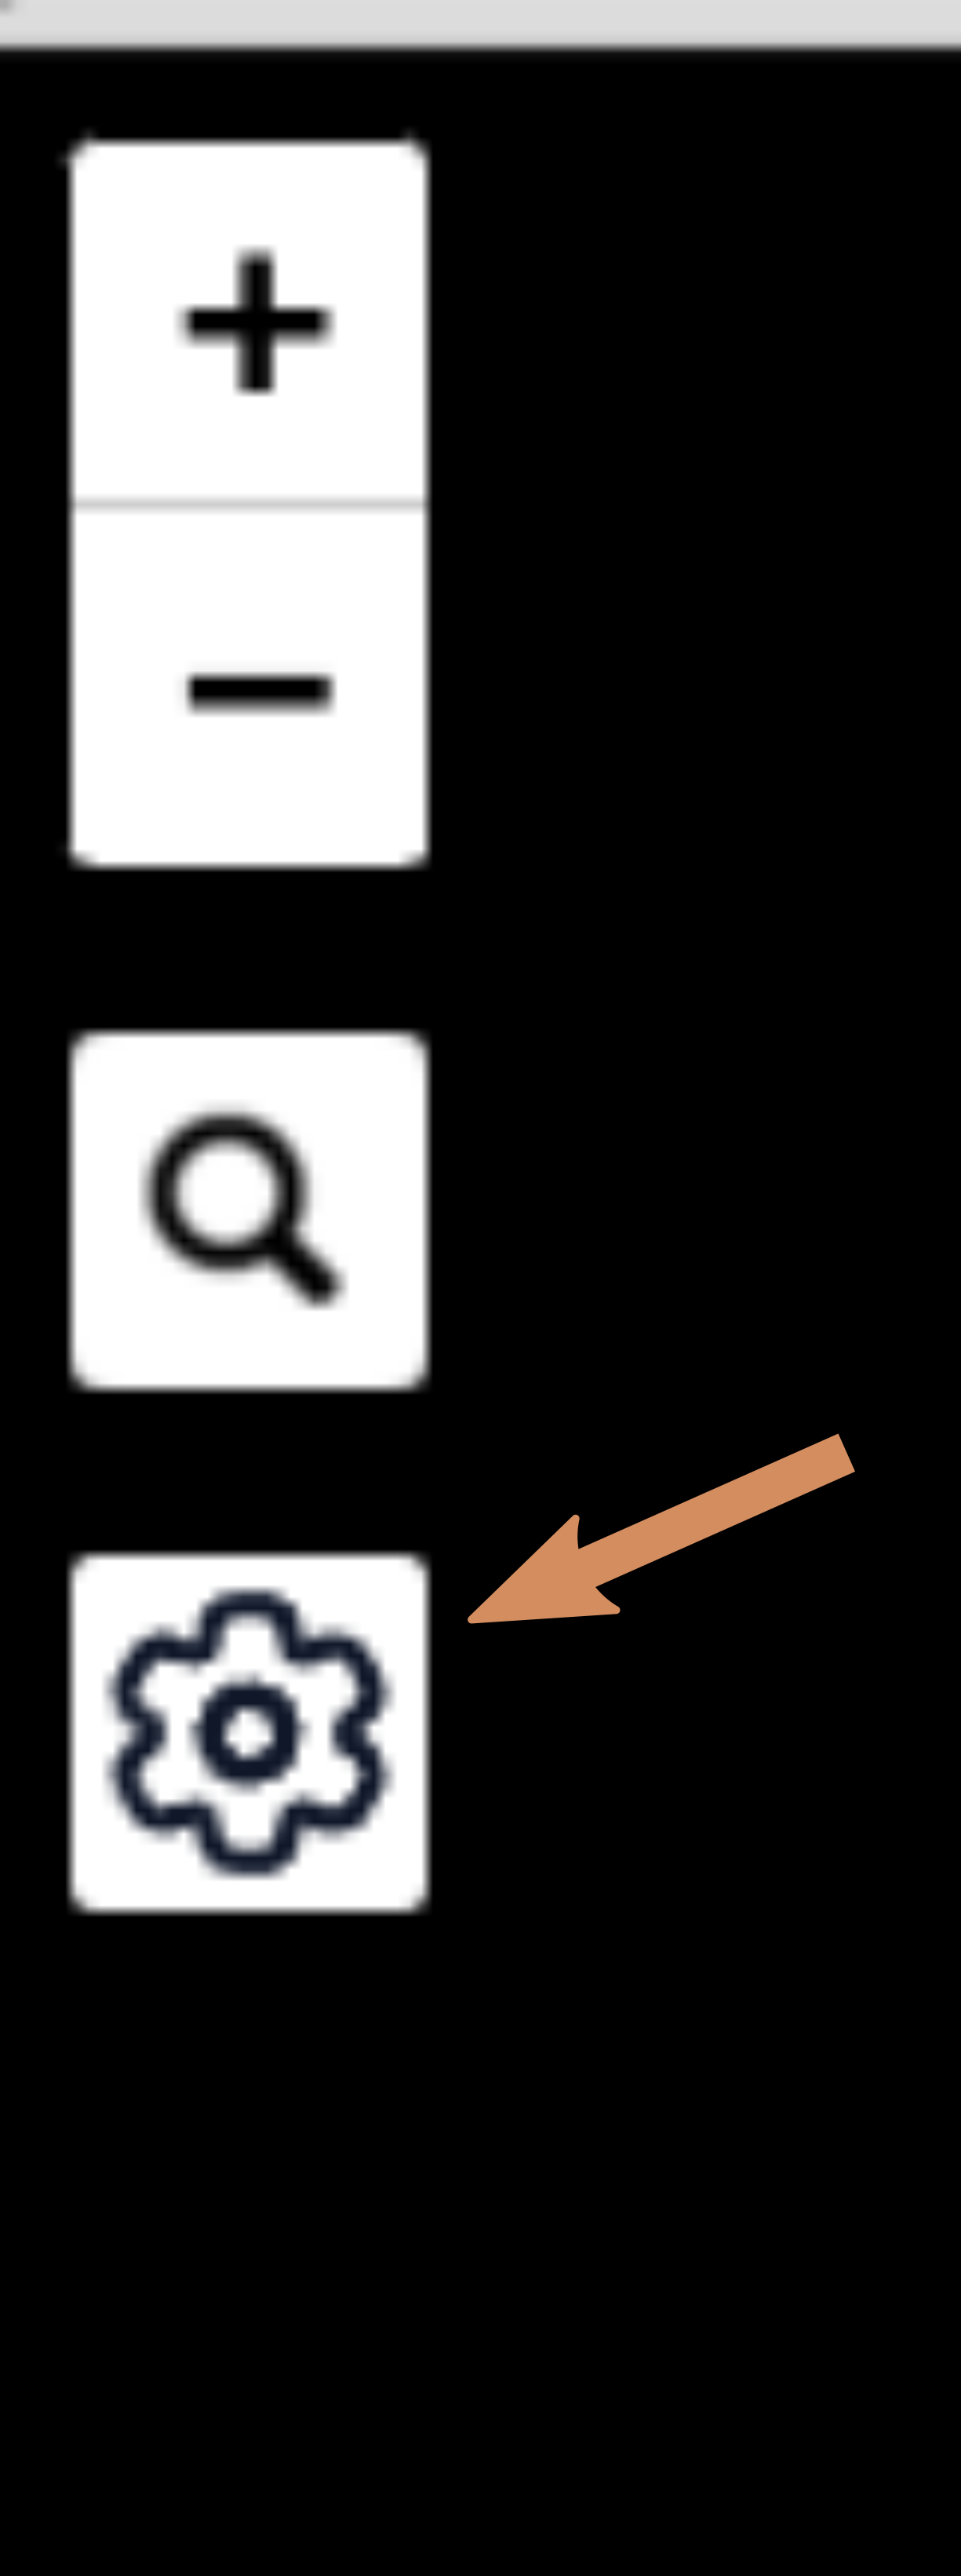
You can adjust the appearance of the image and catalog markers by using the settings tool visible in the top left corner. Note that the changes made using the settings tool are not saved when the webpage is refreshed.
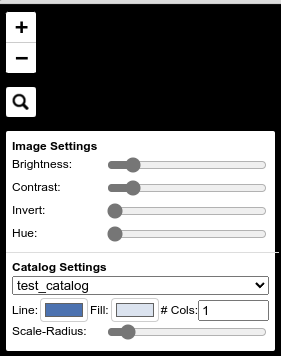
When the button is hovered over, the settings menu will expand to show the following options (Note if there is not a catalog in the FitsMap, then the catalog settings will not be visible):
- Image Settings:
You can edit the brightness, contrast, inversion, and hue of the image by moving the sliders. To reset the setting to its default value, click the label associated with the slider (e.g. "Brightness").
- Catalog Settings:
Use the dropdown menus to select which catalog you would like to adjust the settings for. You can change the outline of the markers using the "Line" menu. You can change the fill color of the markers using the "Fill" menu. You can change the number of columns that are used to display values in the pop-up when a markers is clicked usein the "# Cols" menu. You can change the size of the markers using the "Scale-Radius" slider.
FitsMap supports the parallelization(via ray) of map creation in two ways:
- splitting images/catalogs into parallel tasks
- parallel tiling of an image
- parallel reading/tiling of a catalog
The settings for parallelization are set using the following keyword arguments:
procs_per_task: How many processes can work on a single task.task_procs: Sets how many layers/catalogs to convert in parallel at a time.
You can use both keyword arguments at the same time, but keep in mind the number
of CPUs available. For example, if procs_per_task=2 and task_procs=2
then that will generate 6 new processes, 2 new processes for each task, and each
of those will generate 2 new processes to tile an image in parallel.
Parallelization can offer a significant speed up, so if there are cores available it makes sense to use them.
NOTE: ray's support for Windows is currently in beta, so you may experience some bugs running in parallel on Windows machines. Feel free to submit an issue if you run into any problems.
FITS images are rendered into PNG map tiles using Matplotlib colormaps. The
default colormap used when rendering tiles is "gray". This can be changed by
setting the value of convert.MPL_CMAP to any valid Matplotlib colormap.
To ensure that pixels are rendered correctly and that map markers are placed correctly, any image that is not square is squared by padding the array with NaN values that are converted into transparent pixels in the PNG. As a consequence, if a FITS file contains NaNs when it is converted, those pixels will be converted into transparent pixels.
Catalogs should be delimited text files with the first line containing the
column names, and the following lines containing values. Catalogs need to have
an id column with a unique value for each row. It also needs to have
coordinates for each source, which can be one of the following pairs of columns
(ra / dec) or (x / y). Note fitsmap assumes that the origin of
the image starts at (1,1), but this can be changed to (0,0) by setting the
kwarg catalog_starts_at_one=False.
Some catalogs have many columns for each row, which will create very tall
pop-ups when the markers are clicked. To avoid this, you can pass an integer
value using rows_per_column to either fitsmap.convert.dir_to_map or fitsmap.convert.files_to_map. This
will break the information into rows_per_column sized columns.
Catalog pop-ups are rendered as a simple HTML table, so you can put any HTML friendly things, for example <img> tags, in the catalog and they should be rendered appropriately.
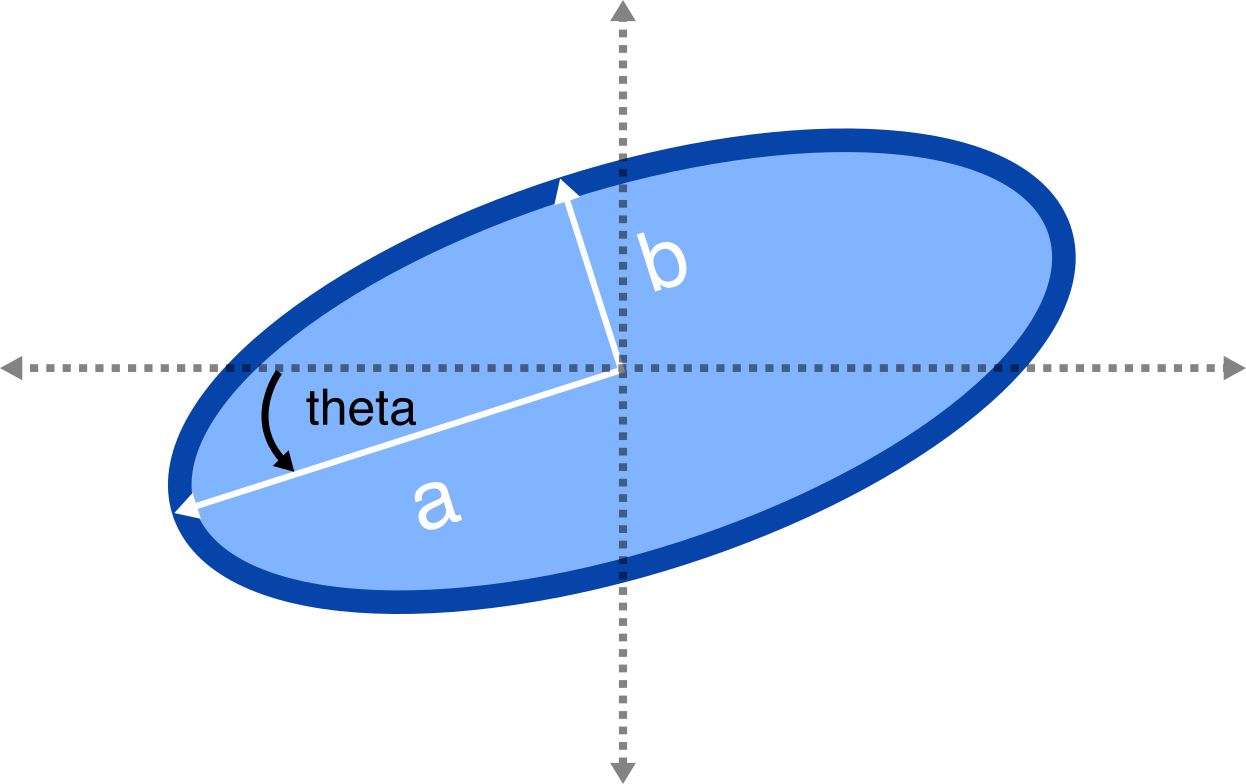
FitsMap will render your markers as Ellipses if you have the following columns
in your catalog: a, b, and theta. Where a is the major axis
radius in pixels, b is the minor axis radius in pixels, and theta
is the rotation of the ellipse in units of degrees starting from the negative
x-axis and moving counter-clockwise.
If you use FitsMap in your research please cite it using the following (also in CITE.bib):
@article{hausen2022a,
     title = {FitsMap: A simple, lightweight tool for displaying interactive astronomical image and catalog data},
   journal = {Astronomy and Computing},
    volume = {39},
     pages = {100586},
      year = {2022},
      issn = {2213-1337},
       doi = {https://doi.org/10.1016/j.ascom.2022.100586},
       url = {https://www.sciencedirect.com/science/article/pii/S2213133722000257},
    author = {R. Hausen and B.E. Robertson},
  keywords = {Astronomy web services (1856), Astronomy data visualization (1968), Astronomy data analysis (1858), Human-centered computing Scientific visualization (10003120.10003145.10003147.10010364), Human-centered computing Visualization toolkits (10003120.10003145.10003151.10011771)},
  abstract = {The visual inspection of image and catalog data continues to be a valuable aspect of astronomical data analysis. As the scale of astronomical image and catalog data continues to grow, visualizing the data becomes increasingly difficult. In this work, we introduce FitsMap, a simple, lightweight tool for visualizing astronomical image and catalog data. FitsMap uses well-understood image tiling techniques and a novel catalog tiling technique to serve gigapixel images with catalogs containing tens of millions of sources using only a simple web server. Further, the web-based visualizations can be viewed performantly on mobile devices. FitsMap is implemented in Python and is open source (https://github.com/ryanhausen/fitsmap).}
}
