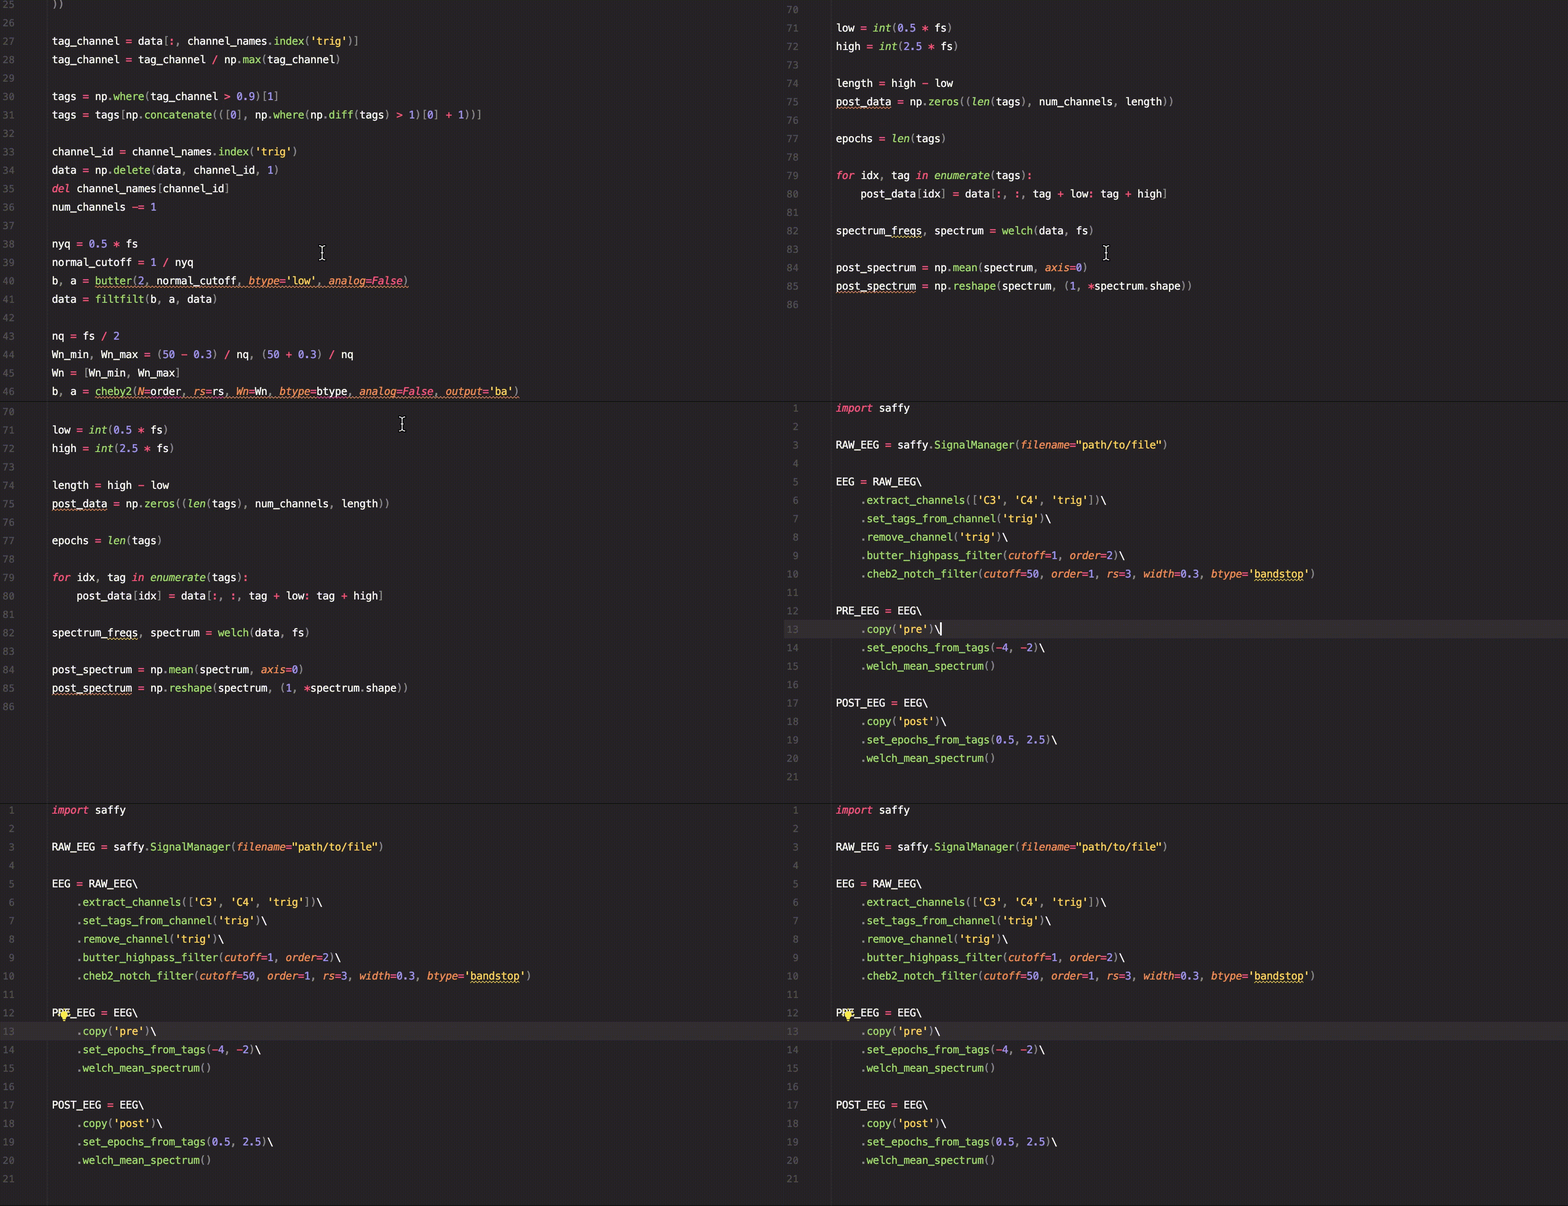
Ever too often in signal analysis is time wasted on the repetitive tasks, which are very similar across projects. You promise yourself to build a code base for your solutions, but end up just copy pasting whole chunks of code. Starting each project you hope that this time you will have good structure and it will be awesome to work with. But it most often fails. Probably because your on a deadline or building sustainable data architectures is not your thing, you just wanted to do some analysis.
Rightfully so! That's why saffy was created, so that you don't have to come up with a data structure and architecture. So that you can concentrate on the fun and important part which is the analysis! When you come up with a solution you like, you already have it as part of the framework, so it is easy to use in the future.
Slack Channel - Github - Documentation
Check out how much code you can spare!
- Write 50% less code than before
- You concentrate on the fun logic stuff and let saffy do the boring repetetive tasks.
- Lost in variables and data? Saffy provides a data architecture to keep it clean.
- Quick prototyping of signal analysis algorithms
- Reproducibility of solutions
- Clean, readable and organized code
- Your code-base can easily expand over multiple projects
- A clean pipline from modeled signals to real-world data
- Less of that brain-less and repetitive work
pip3 install saffy
Using a virtualenv is recommended!
!pip3 install -U https://api.github.com/repos/saffy-team/saffy/zipball/master
or if you want the source code
Download the package to your project directory
git clone https://github.com/saffy-team/saffy.git
Install dependencies
pip3 install -r ./saffy/requirements.txt
import saffy
sig = saffy.SignalManager(generator=signal_data)| field | description |
|---|---|
| fs | sampling frequency |
| num_channels | number of channels |
| channel_names | name for each channel |
| data | the signal in the structure of (epoch x channel x signal) |
| t | time vector |
| epochs | number of epochs |
| tags | position of tags in signal |
| spectrum | matrix of spectrum |
| spectrum_freqs | vector of frequencies |
| phase | matrix of phase |
It takes one labelled argument: generator or filename.
A dictionary of the structure
data = {
      'fs': # float,
      'num_channels': # integer,
      'channel_names': # list of strings,
      'epochs': # integer,
      't': # time array,
      'tags': # list,
      'data': # Signal Matrix
  }
saffy.SignalManager(generator=data)The name of the file generated by Svarog. 3 files eg. data.raw, data.xml, data.tag
saffy.SignalManager(filename='data')Plugins are classes that inherit from the PluginManager. They extend the functionality of the basic Signal Manager. Some plugins are provided out of the box
Adds basic filters
Adds functions to display the signal data
Calculating the Welch Spectrum
Calculating the Hilbert Transform
You might want to add some custom features.
The proposed convention for plugin development is the following. All data that is to be stored extra, should be stored in the form of a dictionary assigned to a variable of the same name as the plugin.
Plugin functions should be preceded by the plugin name.
import saffy

class CustomPlugin(saffy.PluginManager):
    def __init__(self, *args, **kwargs):
        super().__init__(*args, **kwargs)

        self.custom = {
            'param': 'some value'
        }

    def custom_function(self):
        # do something
        pass

saffy.SignalManager.register_plugin(CustomPlugin)

sig = saffy.SignalManager(generator=signal_data)

sig.custom_function()A short example of how to use saffy for EEG data analysis.
import saffy

RAW_EEG = saffy.SignalManager(filename="path/to/file")

EEG = RAW_EEG\
	.extract_channels(['C3', 'C4', 'trig'])\
	.set_tags_from_channel('trig')\
	.remove_channel('trig')\
	.butter_highpass_filter(cutoff=1, order=2)\
	.cheb2_notch_filter(cutoff=50, order=1, rs=3, width=0.3, btype='bandstop')

PRE_EEG = EEG\
	.copy('pre')\
	.set_epochs_from_tags(-4, -2)\
	.welch_mean_spectrum()

POST_EEG = EEG\
	.copy('post')\
	.set_epochs_from_tags(0.5, 2.5)\
	.welch_mean_spectrum()
With just this code we managed to calculate the mean spectrum using Welch's method for the signal before and after the trigger.
fig, ax = plt.subplots(
    nrows=max([PRE_EEG.num_channels, POST_EEG.num_channels]),
    ncols=1,
    sharex=True,
    sharey=True,
    figsize=(10, 10)
)

PRE_EEG.graphics_spectrum_plot(
    fig,
    ax,
    'Change',
    label='Pre'
)

POST_EEG.graphics_spectrum_plot(
    fig,
    ax,
    color='#0000ff',
    label='Post'
)

for a in ax:
  a.legend()

plt.show()
plt.close()If you like the project and want to add something to it then please create a pull request.
- The title should shortly summarize the goal of your addition
- In the description go in depth with the changes you have made and why.


