-
Notifications
You must be signed in to change notification settings - Fork 116
Monitoring
Rexster comes with a variety of options for monitoring given its integration with Metrics. Rexster continually gathers information about itself as it is accepting requests and sending back responses. This information is then periodically sent to the reporters configured in rexster.xml.
Rexster supports the following reporters: Console, JSON-based web service via HTTP, JMX, Ganglia and Graphite
The metrics provided by Rexster can help inform administrators of Rexster’s health and include things like:
- Gremlin script engine processing times
- REST endpoint request/response times
- Underlying JMX attributes from Grizzly and Jersey
Rexster comes with a pre-configured through rexster.xml to report metrics through several reporters. The easiest one to get started with is the REST endpoint. Start Rexster and issue a query such as:
curl http://localhost:8182/graphs/tinkergraphthen resolve the following URL to get a current snapshot of the metrics gathered by Rexster:
http://localhost:8182/metricsLook for this particular key in the returned JSON: http.rest.graphs.object.get and it will look something like this:
...
http.rest.graphs.object.get: {
  count: 1,
  max: 0.0013546230000000001,
  mean: 0.0013546230000000001,
  min: 0.0013546230000000001,
  p50: 0.0013546230000000001,
  p75: 0.0013546230000000001,
  p95: 0.0013546230000000001,
  p98: 0.0013546230000000001,
  p99: 0.0013546230000000001,
  p999: 0.0013546230000000001,
  stddev: 0,
  m15_rate: 0.006394042634681005,
  m1_rate: 0.0010423449272394232,
  m5_rate: 0.002751971906724164,
  mean_rate: 0.01219546753135717,
  duration_units: "seconds",
  rate_units: "calls/second"
},
...All configuration of metrics reporting is handled through rexster.xml. With in that file, there is a <metrics> element, which contains one or more <reporter> elements. These <reporter> elements represent places where Rexster will make gathered metrics available. Basic reporter configuration looks like this:
<rexster>
  ...
  <metrics>
    <reporter>
      <type>console</type>
    </reporter>
  </metrics>
  ...
</rexster>
The <type> may be one of the following options: console, http, jmx, ganglia or graphite.
| type | description | behavior | common 1 |
|---|---|---|---|
console |
Metrics written to the console at predefined periods. | scheduled push | Yes |
http |
Metrics served via HTTP as a REST-based service. | on-demand | No |
jmx |
Metrics served as MBean to be consumed by tools like VisualVM. | on-demand | No |
ganglia |
Metrics pushed to Ganglia on a schedule. | scheduled push | Yes |
graphite |
Metrics pushed to Graphite on a schedule. | scheduled push | Yes |
1 – Uses Common Configuration settings explained below.
To include Grizzly-level JMX attributes in reported metrics, ensure that the <enable-jmx> option is set to true for either the <http> and/or <rexpro> configuration elements.
Rexster provides configuration options for several different reporters.
When the Console Reporter is configured, Rexster will periodically send its metrics to the console output. This reporter is mostly useful for debugging and demonstration purposes. Output looks something like:
4/26/13 5:01:14 PM =============================================================

-- Counters --------------------------------------------------------------------
rexpro.script-engine.fail
             count = 0
rexpro.script-engine.success
             count = 113650
-- Timers ----------------------------------------------------------------------
rexpro.script-engine
             count = 114633
         mean rate = 4074.89 calls/second
     1-minute rate = 1464.61 calls/second
     5-minute rate = 442.48 calls/second
    15-minute rate = 252.12 calls/second
...The HTTP Reporter configures a servlet that converts metrics to JSON and serves them on request.
After starting Rexster, metrics can be accessed at:
http://localhost:8182/metrics{
"name": "rexster",
"version": "3.0.0",
"counters": {
"rexpro.script-engine.fail": {
"count": 0
},
"rexpro.script-engine.success": {
"count": 359677
}
},
...
}The HTTP Reporter configuration does not support the <includes> or <excludes> elements.
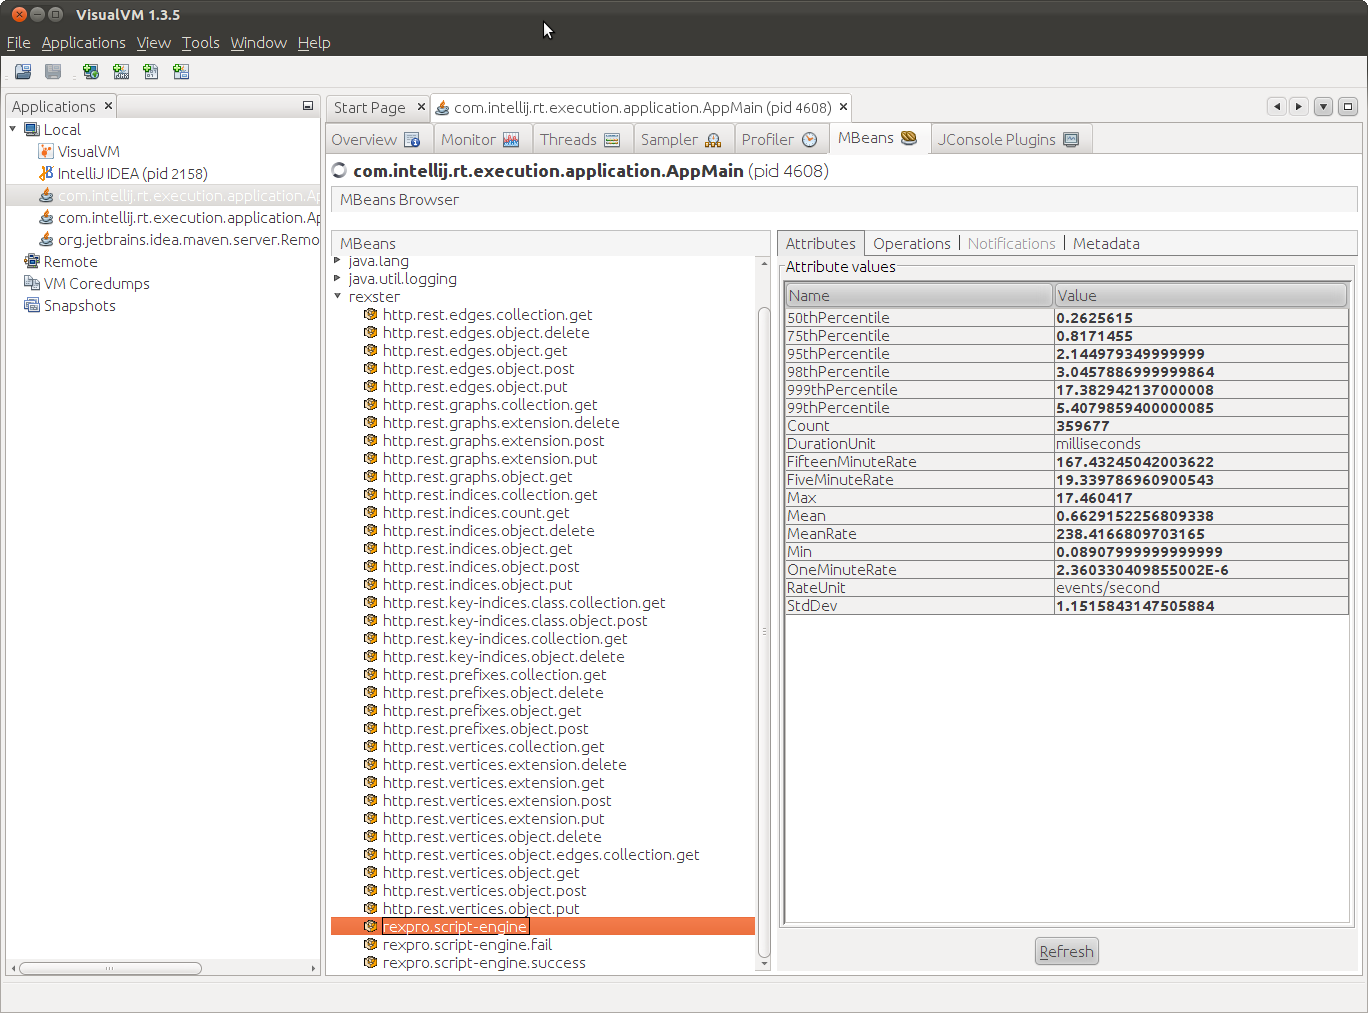
When JMX is configured as a reporter, it is possible to use a tool like VisualVM to connect to the running JVM process. There is a rexster MBean that contains the metrics:
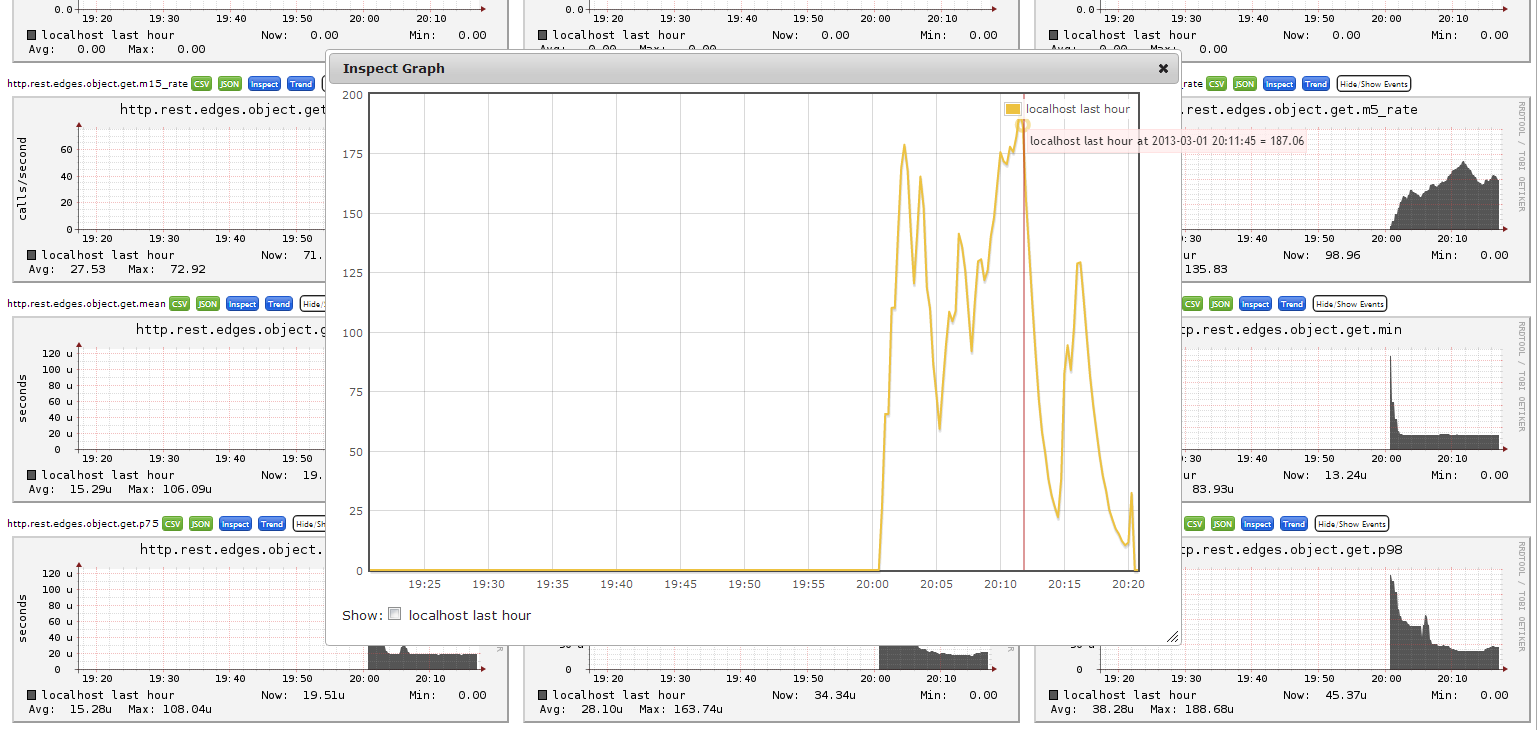
Ganglia is a scalable distributed monitoring system for high-performance computing systems. When Ganglia is configured as a reporter, Rexster will periodically send metrics to a Ganglia server. In addition to the Common Configurations (described below), the Ganglia <properties> can include:
<properties>
  <hosts>localhost:8649</hosts>
</properties>
The <hosts> property tells the reporter the server to send the metrics to and the example value supplied above is the default value for the configuration if none is specified. The metrics are sent via UDP multicast addressing.
Graphite is a highly scalable real-time graphing system. When Graphite is configured as a reporter, Rexster will periodically send metrics to a Graphite server. In addition to the Common Configurations (described below), the Ganglia <properties> can include:
<properties>
  <hosts>localhost:2003</hosts>
  <prefix></prefix>
</properties>
The <hosts> property tells the reporter the server to send the metrics to and the example value supplied above is the default value for the configuration if none is specified. The <prefix> represents an additional user-defined key to append to the front of metrics reported. By default this value is an empty string.
Getting started with Graphite is easy to do when using a hosted solution such as Hosted Graphite. First, create an account and make note of the provided API key. Second, add the following to rexster.xml where the <prefix> element must contain the API key:
<properties>
  <hosts>carbon.hostedgraphite.com:2003</hosts>
  <prefix>api-key-goes-here</prefix>
  <properties>
    <rates-time-unit>SECONDS</rates-time-unit>
    <duration-time-unit>SECONDS</duration-time-unit>
    <report-period>10</report-period>
    <report-time-unit>SECONDS</report-time-unit>
    <includes>rexpro.*</includes>
   </properties>
</properties>
If using a trial account, be sure to filter metrics sent to Hosted Graphite as it only allows 100 metrics to be consumed and by default Rexster will send many more than that. In the above configuration, Rexster will only send RexPro-based metrics which is far fewer than 100. After starting Rexster and issuing a few RexPro based commands (e.g. connecting Rexster Console and issuing some commands), log-in to Hosted Graphite and view the metrics collected.
Reporters that “push” metrics on a schedule have common configuration and default settings as set through the <properties> element of the <reporter>. The common configuration looks like this:
<reporter>
  ...
  <properties>
    <rates-time-unit>SECONDS</rates-time-unit>
    <duration-time-unit>SECONDS</duration-time-unit>
    <report-period>60</report-period>
    <report-time-unit>SECONDS</report-time-unit>
    <includes>http.rest.*</includes>
    <excludes>http.rest.*.delete</excludes>
   </properties>
</reporter>
The time unit values correspond to the java.util.concurrent.TimeUnit enum values of:
- NANOSECONDS
- MICROSECONDS
- MILLISECONDS
- SECONDS
- MINUTES
- HOURS
- DAYS
The <rate-time-unit> and <duration-time-unit determine the unit of time at which data will be formatted when reported. The <report-period> and <report-time-unit determine how often the data will be sent out via the reporter. The default settings for these values are shown above in the sample configuration.
Rexster generates many metrics and not all may be useful. It is possible to filter these metrics with the <includes> and <excludes> elements. Both take a regex statement to filter metric keys in or out of the reported set. The HTTP Reporter does not support these attributes.
This section outlines the metrics that are gathered by Rexster. All keys are prefixed with rexster when reported.
| type | key | description |
|---|---|---|
| gauge | http.core.heap-memory-manager.* | Grizzly JMX measurements. 2 |
| gauge | http.core.http-keep-alive.* | Grizzly JMX measurements. 2 |
| gauge | http.core.http-server.* | Grizzly JMX measurements. 2 |
| gauge | http.core.network-listener.* | Grizzly JMX measurements. 2 |
| gauge | http.core.tcp-nio-transport.* | Grizzly JMX measurements. 2 |
| gauge | http.core.thread-pool.* | Grizzly JMX measurements. 2 |
| timer | http.script-engine | A timer on script execution and results serialization on the Gremlin Extension. |
| counter | http.script-engine.success | Number of successfully executed scripts on the Gremlin Extension. Incremented after successful serialization of results. |
| counter | http.script-engine.fail | Number of script execution failures on the Gremlin Extension. Incremented if failure occurs on or during script evaluation or result serialization. |
| timer | http.rest. resource. type . method 1 | A timer on the request/response for a given RESTful endpoint. |
| gauge | rexpro.core.heap-memory-manager.* | Grizzly JMX measurements. 2 |
| gauge | rexpro.core.tcp-nio-transport.* | Grizzly JMX measurements. 2 |
| gauge | rexpro.core.thread-pool.* | Grizzly JMX measurements. 2 |
| timer | rexpro.script-engine | A timer on script execution and results serialization via RexPro. |
| counter | rexpro.script-engine.success | Number of successfully executed scripts via RexPro. Incremented after successful serialization of results. |
| counter | rexpro.script-engine.fail | Number of script execution failures via RexPro. |
| gauge | rexpro.sessions | Number of open RexPro sessions. |
1 – The key for RESTful endpoints is made up of several elements. The resource is the name of the resources and will be one of the following: graphs, edges, indices, key-indices, prefix or vertices. The type determines whether the service returns a collection, a single object, or is the start point for an extension (e.g. a set of vertices, single vertex, or an extension that triggers from a vertex). The method is the HTTP verb that was executed on the endpoint. There are some cases where additional resource.type combinations will follow that basic pattern where the hierarchy allows (e.g. http.rest.vertices.object.edges.collection.get which is the key for GET http://server/graphs/graph/vertices/1/out.
2 – JMX must be enabled for the respective <http> or <rexpro> sections of rexster.xml for these measurements to be available.
Rexster Extensions make it possible to plug-in new features as RESTful endpoints. While the prefixes for extension endpoints are monitored by default, there is no specific metric for individual extensions themselves. To get a more granular view of extension operations, it is possible to register custom metrics using the MetricsRegistry on the RexsterResourceContext. For more information on how to create custom metrics, see the Metrics documentation and the Sample Kibbles.


