Statistics
Spike offers a wide range of statistics.
Statistics can be found at the bottom of the main (chart) screen and are divided in 3 categories:
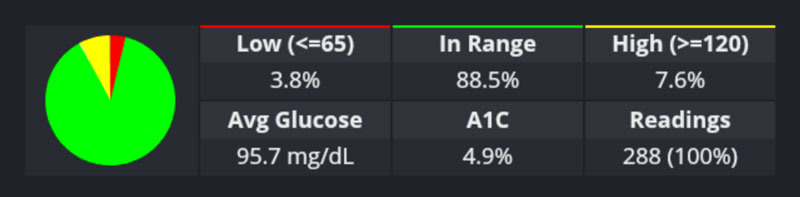
- Low: Percentage of low and urgent low glucose readings based on the user's settings (settings > general). Also displayed on the pie chart situated on the left side. Calculated using the following formula: (number of low readings * 100) / total number of readings.
- In Range: Percentage of in range glucose readings based on the user's settings (settings > general). Spike assumes all readings above the low threshold and below the high threshold are considered in range. Also displayed on the pie chart situated on the left side. Calculated using the following formula: (number of in range readings * 100) / total number of readings.
- High: Percentage of high and urgent high glucose readings based on the user's settings (settings > general). Also displayed on the pie chart situated on the left side. Calculated using the following formula: (number of high readings * 100) / total number of readings.
- Average Glucose: The average of all readings. It’s an overall measure of blood sugars over a period of time, offering a single high-level view of where glucose has been. A lower value often indicates fewer high blood sugars; however, it can also indicate a high number of low blood sugars (hypoglycemia) occurrences. Calculated using the following formula: sum of all readings / total number of readings.
- A1C: Known as glycated haemoglobin. Produced when glucose (sugar) in the body sticks to red blood cells. Red blood cells are active for around 2-3 months, which is why the reading is taken quarterly. Higher A1C levels correlate with poor glucose management. Spike can calculate A1C in NGSP and IFCC formats. NGSP is calculated using the following formula: (46.7 + average blood glucose in mg/dL) / 28.7. IFCC is calculated using the following formula: (NGSP A1C - 2.15) * 10.929. Taken from from:Nathan, David M., et al. "Translating the A1C assay into estimated average glucose values." Diabetes care 31.8 (2008): 1473-1478.
- Capture Rate (Readings): How well the Bluetooth connection between Spike and the transmitter is performing. Normally, transmitters send readings every 5 minutes giving a total of 288 readings a day (MiaoMiao being an exception as it supports readings on demand). Calculated using the following formula: number of total readings from the last 24h.
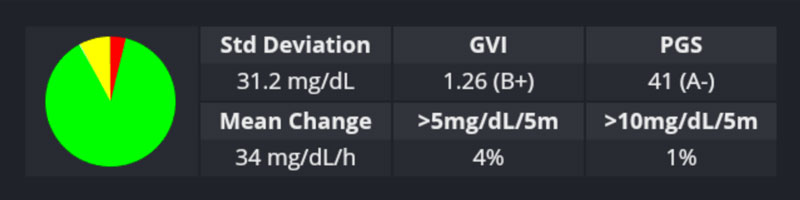
- Standard Deviation: Measure of the spread in glucose readings around the average. Lower values reflect a steadier glucose level with minimal swings. More information (including formulas) is available here.
- GVI: Stands for Glycemic Variability Index. This is a metric developed by Dexcom and more information is available here and here. Spike attributes a rating ranging from <1.1 (A+) to >1.95 (F-). Values ranging from 1.0 to 1.2 are non-diabetic and will be flagged by Spike with a (ND) text next to the grade.
- PGS: Stands for Patient Glycemic Status. This is a metric developed by Dexcom and more information is available here and here. Spike attributes a rating ranging from <25 (A+) to >160 (F-). Values lower or equal to 35 are non-diabetic and will be flagged by Spike with a (ND) text next to the grade.
- Mean Hourly Change: Sum of the absolute value of all glucose excursions for the examined period, divided by the number of hours in the period. Lower is better. Calculated using the following formula: total delta / total days / 24.
- Time in Fluctuation (Moderate): Measures the % of time during which the blood glucose has been changing at a rate bigger than 5mg/dL/5m and lower or equal than 10mg/dL/5m. Lower values are better. Calculated using the following formula: (number of readings with delta > 5mg and <= 10mg * 100) / number of total readings.
- Time in Fluctuation (Rapid): Same as the moderate but accounting for rates bigger than 10mg/dL/5m. Calculated using the following formula: (number of readings with delta > 10mg * 100) / number of total readings.
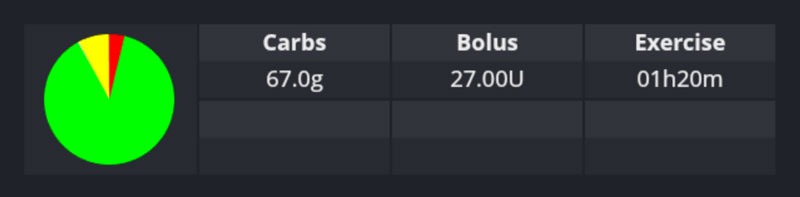
- Carbs: Total carbs, in grams, for the specified period.
- Bolus: Total carbs, in units, for the specified period.
- Exercise: Total exercise duration, in minutes, for the specified period.
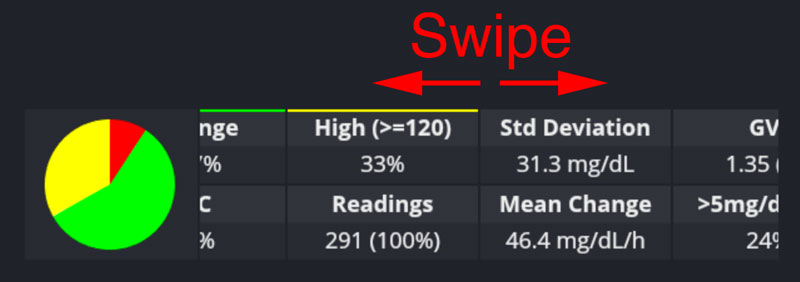
To navigate between different statistics' sections just swipe your finger to the left-right on the text area.
Settings for statistics can be accessed in two ways:
- Press and hold for 1 second on the statistics text at the bottom of the chart screen.
- Navigate to main menu > settings > chart.
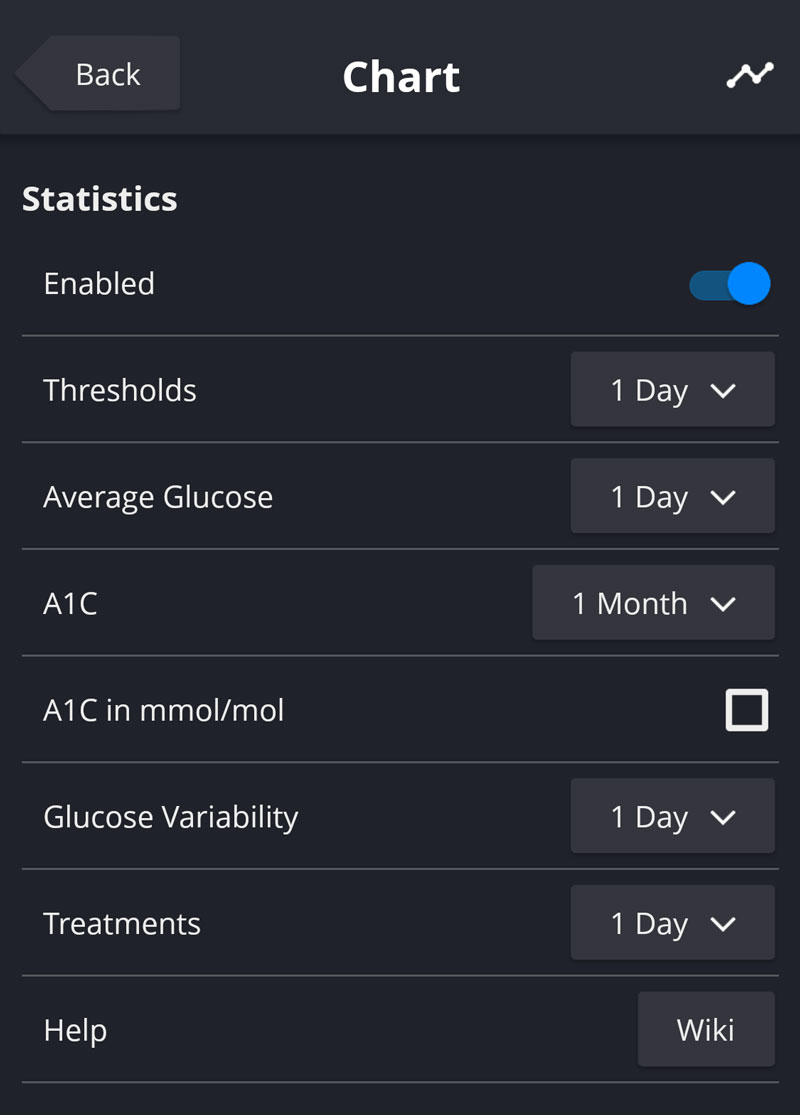
Available settings are:
- Enable/Disable: Spike allows you to disable statistics (and the pie chart) completely. If statistics are disabled, the glucose chart on the main screen will take all the available screen height.
- Examined Period: Specifies the time range (meaning: now - selected amount of time) used in calculations. This setting is only available to masters and allows statistics for: 1 day, 2 days, 3 days, 1 week, 2 weeks, 1 month and 3 months. Examined period can be customized for all statistics except capture rate which always represents the last 24h.
- A1C Format: Enabling the "A1C in mmol/mol" settings will display A1C in IFCC format.
- Wiki: Will take you to this page.