Example Visualizations
This is a page for us to put in-progress and example visualizations to share.
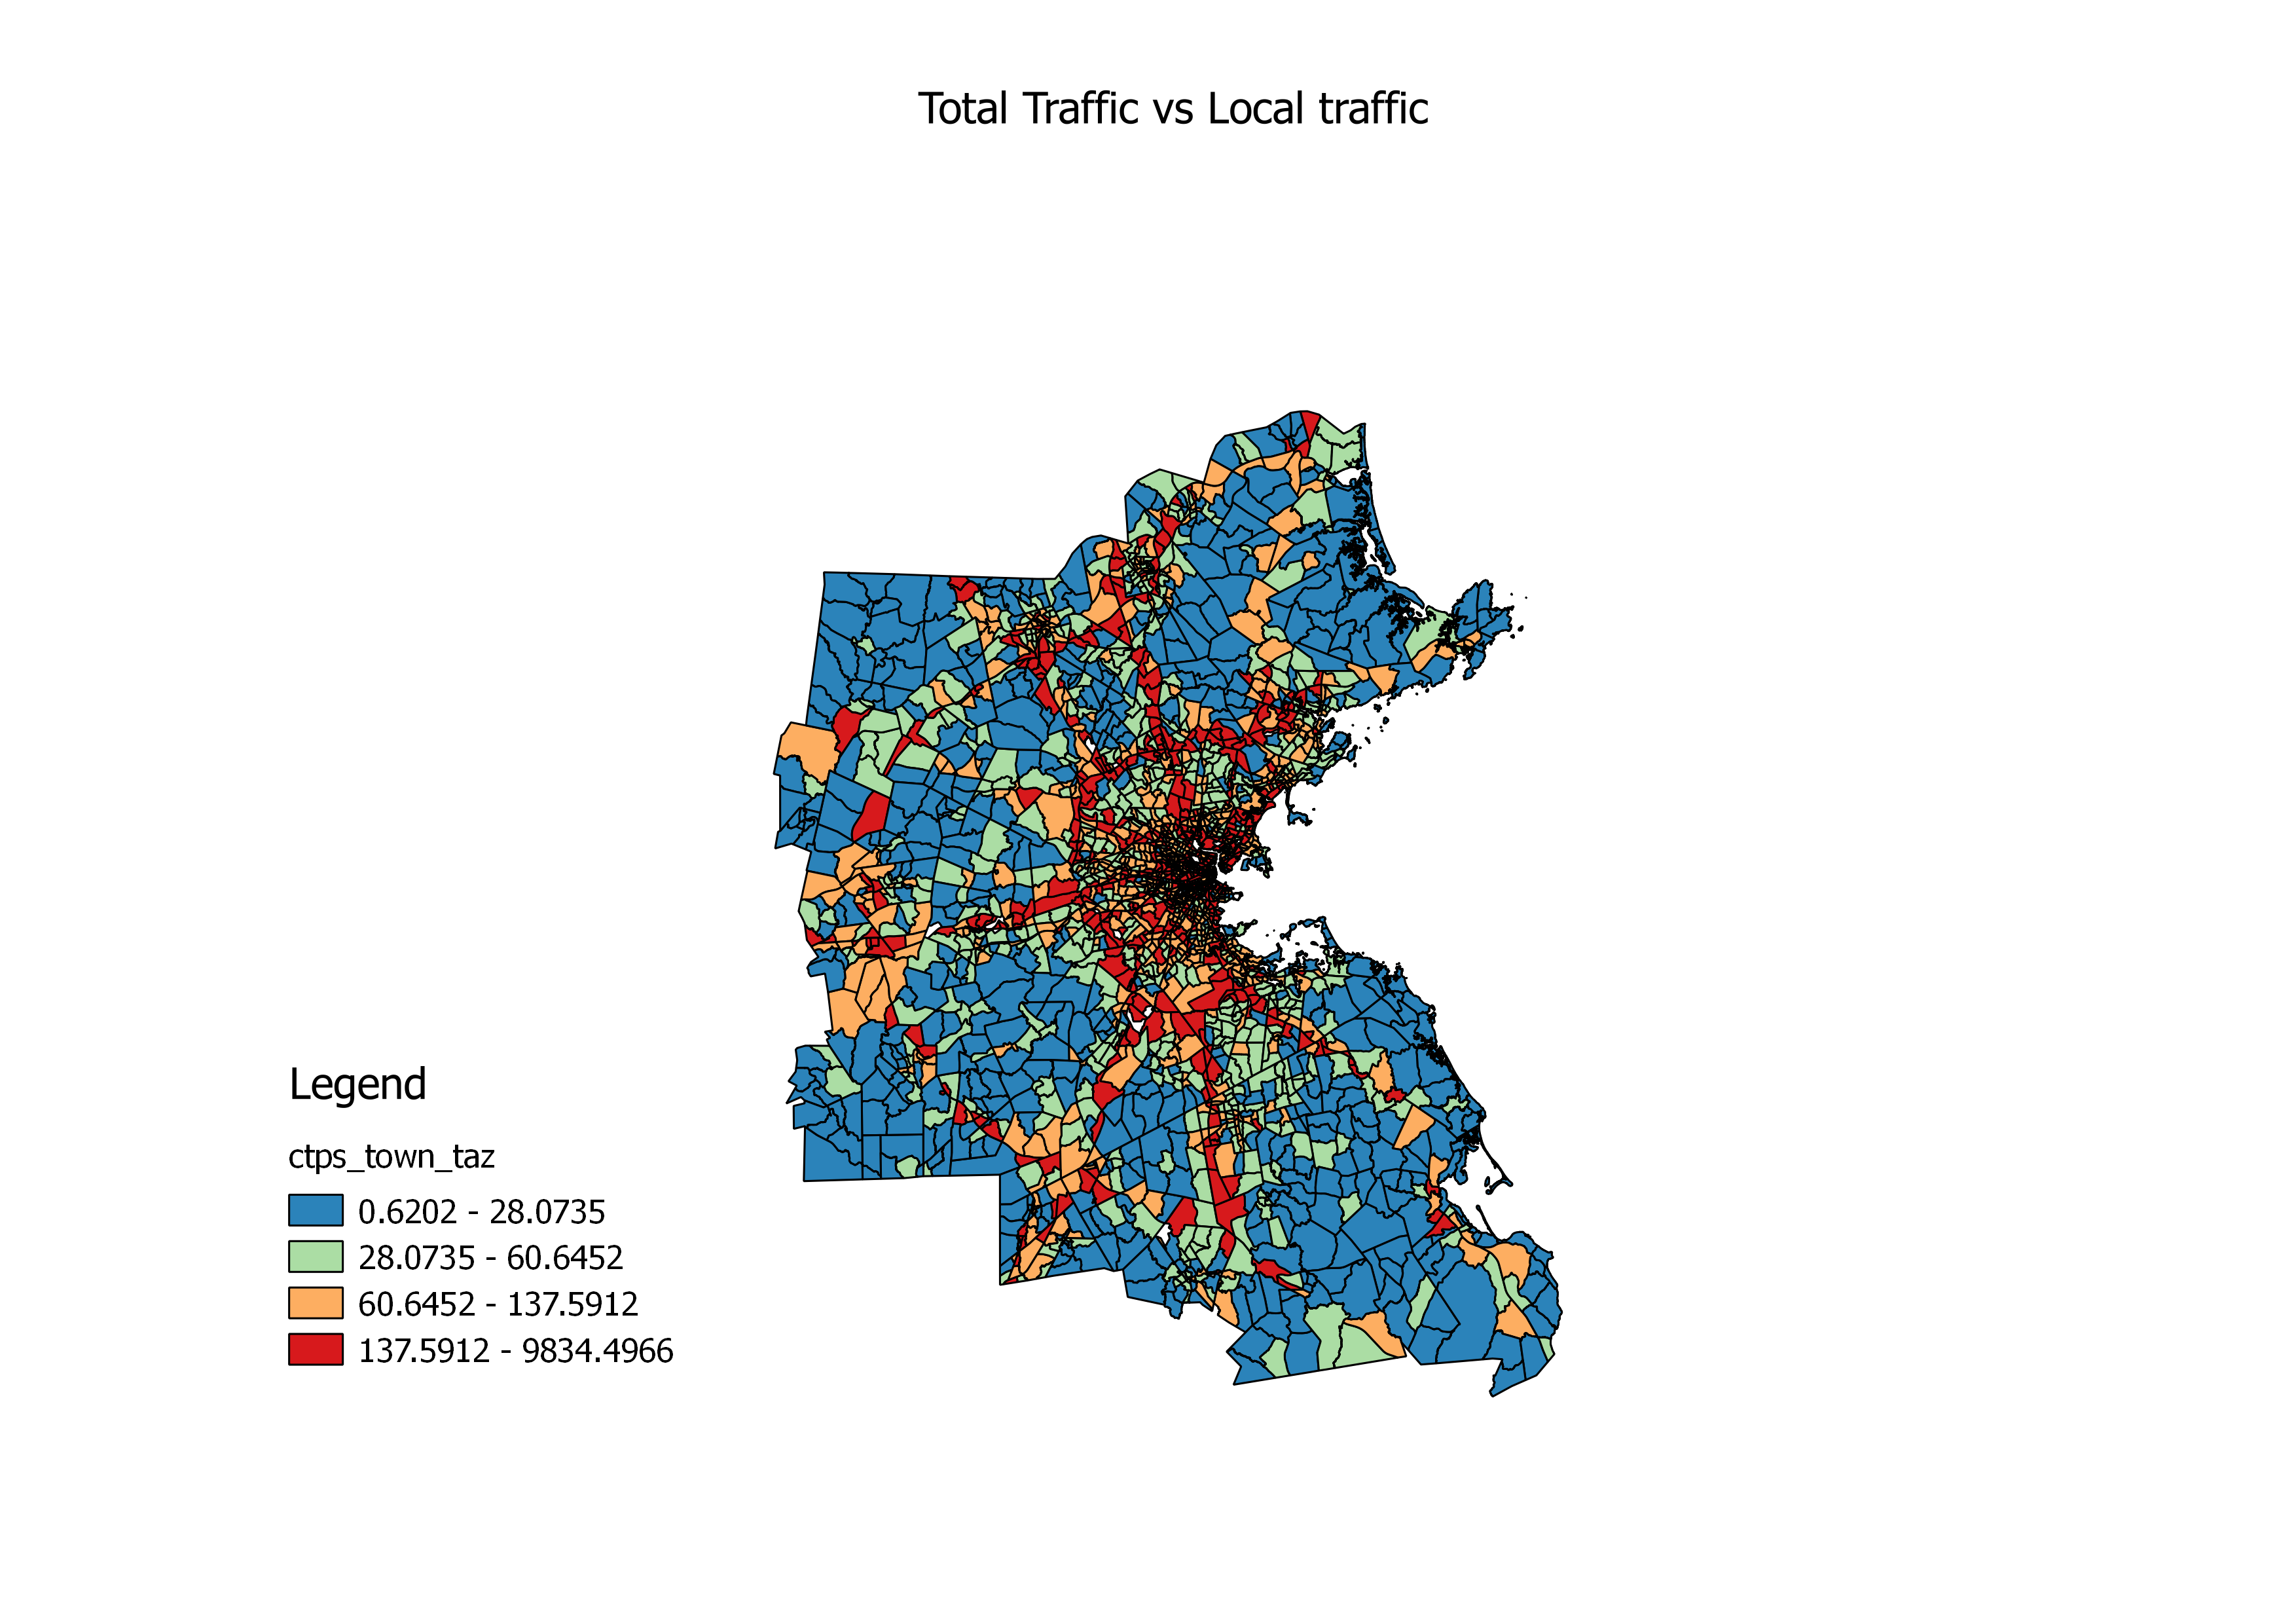
This image of the vehicle miles traveled (VMT) divided by total miles per day in each traffic analysis zone (TAZ) highlights the inequality between places with more vehicle traffic and places where the registered cars drive more miles. Near-highway areas and the Boston metropolitan area pop out as places with exceptionally high traffic volumes and low driving.
Traffic due to passenger vehicles in each TAZ was obtained from grid_quarters_public (mipdaypass). Each grid was assigned to the TAZ which had the highest spatial overlap. TAZ and VMT layers were obtained through CTPS. The image was produced in QGIS.
# R code to generate the figure.
library(RPostgreSQL)
# Start Driver
drv = dbDriver("PostgreSQL")

# new connection
con <- dbConnect(drv, user="massdrive",dbname="massdrivedata")

# rs <- dbSendQuery(con,"select mipdaypass from grid_quarters_public")
# mipdaypass = fetch(rs,n=-1)$mipdaypass
# dbClearResult(rs)

members <- dbSendQuery(con,"select g250m_id,taz_id from g250m_taz_membership")
members = fetch(members,n=-1)
# dbClearResult(members)

mipdaypass <- dbSendQuery(con,"select g250m_id,mipdaypass from grid_quarters_public where quarter = '2010_q2'")
mipdaypass = fetch(mipdaypass,n=-1)
# dbClearResult(mipdaypass)

taz_data_2010 <- dbSendQuery(con,"select taz_id,vmt from taz_data_2010")
taz_data_2010 = fetch(taz_data_2010,n=-1)
# dbClearResult(taz_data_2010)

# Merge by grid miles per day to TAZ-grid membership table
temp1 <- merge(members,mipdaypass,by="g250m_id")

# Aggregate grid to TAZ level
gridtotaz = aggregate(temp1$mipdaypass,by=list(temp1$taz_id),sum,na.rm=F)
names(gridtotaz) = c("taz_id","mipdaypass")

# Merge aggregated grid data to TAZ data
temp2 <- merge(gridtotaz,taz_data_2010,by = "taz_id")
temp2$ratio = ifelse(temp2$mipdaypass>0,temp2$vmt/temp2$mipdaypass,NA)

# write to csv file
write.csv(subset(temp2,!is.na(ratio)),"ratio2.csv",row.names=F)


## Closes the connection
dbDisconnect(con)

## Frees all the resources on the driver
dbUnloadDriver(drv)