-
Notifications
You must be signed in to change notification settings - Fork 7
‒m variance
Thomas Nipen edited this page Nov 7, 2017
·
9 revisions
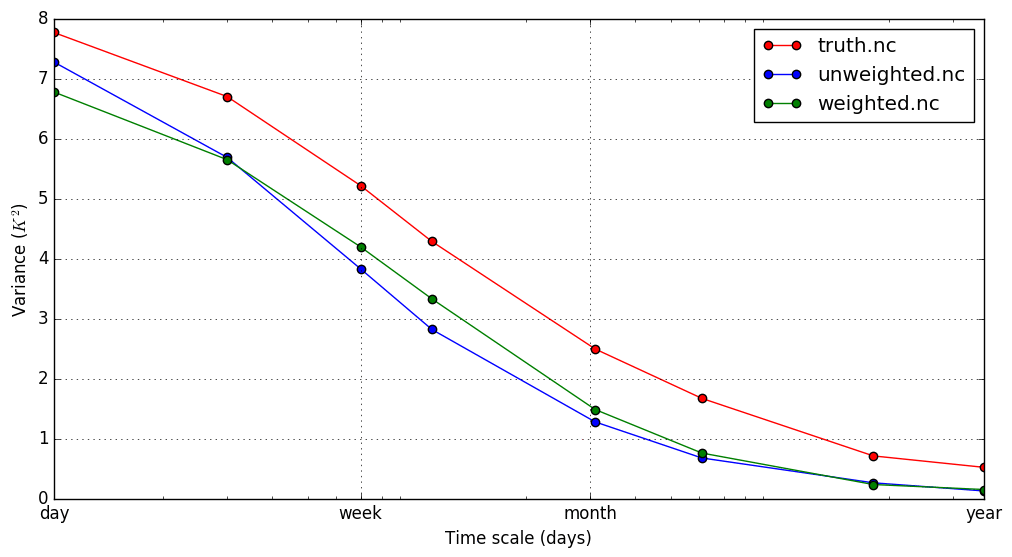
The variance plot shows the variance among members for different time scales (day, week, month and year).
wxgen verif truth.nc unweighted.nc weighted.nc -v 0 -m variance -xlogTo compute variance, the climatology is first removed from the signal. After this, the variance is computed for all days collectively.

The -xlog option make the x-axis logarithmic, which makes it easier to view the full range of timescales. -ylog option is also supported.
Copyright © 2016-2019 Norwegian Meteorological Institute
- Home
- Creating scenarios
- Creating truth scenarios
- Verification
- Other
- Developing
- Change log