-
Notifications
You must be signed in to change notification settings - Fork 13
NewIn33
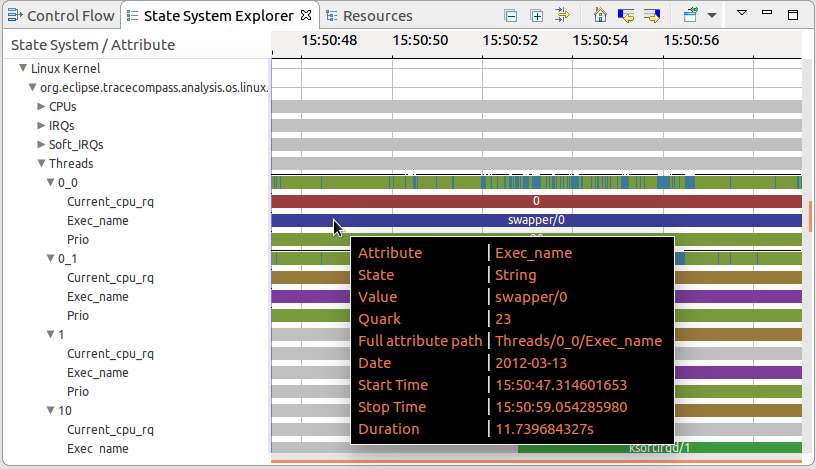
The State System explorer is now a Time Graph View, which makes it easier to understand the states stored by different analysis.
As before, the view is opened with the tree (in this case the entry tree) expanded up to the state system level.
Double clicking on an analysis which has not started yet starts it, else double clicking entries expands or collapses them.
Intervals with null states appear as transparent states, and other state values are assigned a color.
The tool tips show the value, type, quark, full path, start, end and duration of an interval.

Export views allows sharing findings with people outside of Trace Compass.

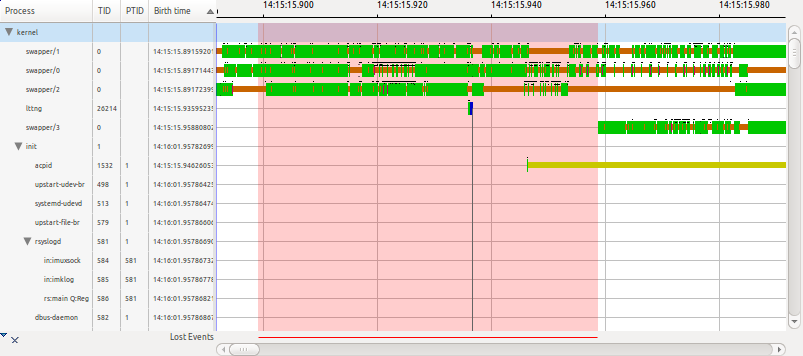
The Control Flow View gains the ability to filter by active threads and active threads on certain CPU on the visible time range.
The new filter is accessed via the view drop down menu > Dynamic Filters > Configure...
The filter also works for experiments.

This analysis shows the latency between 2 events using the event matching mechanism. It can be used to visually see how accurate event matching is through time, before or after synchronization.
The user can now choose between copying only the link or the content of the trace.
The user can now choose duplicate an experiment that will copy also the contained traces.
The Eclipse Status Bar now shows the selection range and cursor time for the XY views too. (Only Timegraphs were supported previously.)
Pin and clone is also supported in XY Charts now. (Only Timegraphs were supported previously.)
The Sort actions in the Call Stack View (to sort the view by thread Name, thread ID or start time) are replaced by using sortable columns in the left hand part of the viewer. A PID/TID column is added to that viewer to ensure all sorts are still available. Now the columns are:
- Name (Trace / Process / Thread / Symbol Name) - (Sortable)
- PID / TID (Sortable)
- Depth (Sortable -> switch from icicle to flame and vice versa)
- Start Time (Sortable)
- End Time (Sortable)
- Duration (Not sortable)
The data-driven analysis internal design has been rewritten to separate compilation unit and execution. This allows for better validation of the XML analysis.
More support for Data Providers have been provided for both XY views and Time Graph views to decouple UI and Core components.
It is now possible for Trace Compass adopters to implement their own legend implementation for Time Graph views. An API has been added to the Time Graph views.
Kernel and UST traces now have different icons in the project explorer:
- Kernel:

- UST:

See Bugzilla report Bugs Fixed in Trace Compass 3.3.0